
Week 10-15 June 2018
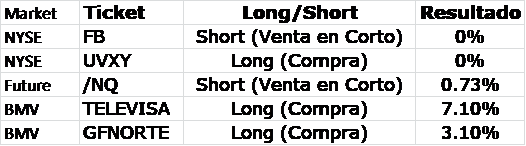
June 17, 2018 1:08 am| Market | Ticket | Long/Short |
| NYSE | FB | Short (Venta en Corto) |
| NYSE | UVXY | Long (Compra) |
| Future | /NQ | Short (Venta en Corto) |
| BMV | TELEVISA | Long (Compra) |
| BMV | GFNORTE | Long (Compra) |
These are the trade that I will follow during the week. I comment as an opinion and should not be taken as financial advice. If you have any doubt, read the Terms and Conditions of the site.

FB indicated on the 4hr chart on the left with the red lines crossing below the blue one, a potential short selling trend at the beginning of the week that then reversed mid-week, leaving the short sale trade without effect .

UVXY is an ETF that operates with the volatility of the market shortenado the VIX last week this ETF remained in its trend without marking a clear sense signal so I do not enable trade of purchase in the week.

The future of the Nasdaq is / NQ a signal in the 4 hr chart of potential short selling trend, but the reality is that it never had a clear strength in the 4hr chart with this trend, which gave 2 sales trade short but very random and of short duration that offered 0.76% in the week.

Televisa is an stock traded on the BMV but also has a ticket as ADR on NYSE as TV, gave a signal of potential trend to purchase on the 4hr chart on the left so entering long in the week as indicated in the graph on the right gave 7%.

GFNORTE is listed on the BMV and gave a signal of potential purchase trend at the MACD crossing of the left so that the graph on the right shows the inputs and outputs where I end up giving 3.1% in the week. To the question of how entry and exit is very easy entry as we know is when the price cuts up the green line of 21 periods and the blue line of momentum the zero line from bottom to top and the output we see it when the Price begins to lateralize or cut in the other direction the green line of 21 periods as seen in the graph on the right.
Comments are closed here.