

Week 25-29 June 2018
June 23, 2018 11:16 pm| Market | Ticket | Long/Short | Result |
| NYSE | x | Short (Venta en Corto) | 4.4% |
| NYSE | UVXY | Long (Compra) | 19.2% |
| NYSE | CLF | Short (Venta en Corto) | 3.7% |
| BMV | TELEVISA | Short (Venta en Corto) | 0.6% |
| BMV | Gmexico | Short (Venta en Corto) | 3.0% |
These are the trade that I will follow during the week. I comment as an opinion and should not be taken as financial advice. If you have any doubt, read the Terms and Conditions of the site.
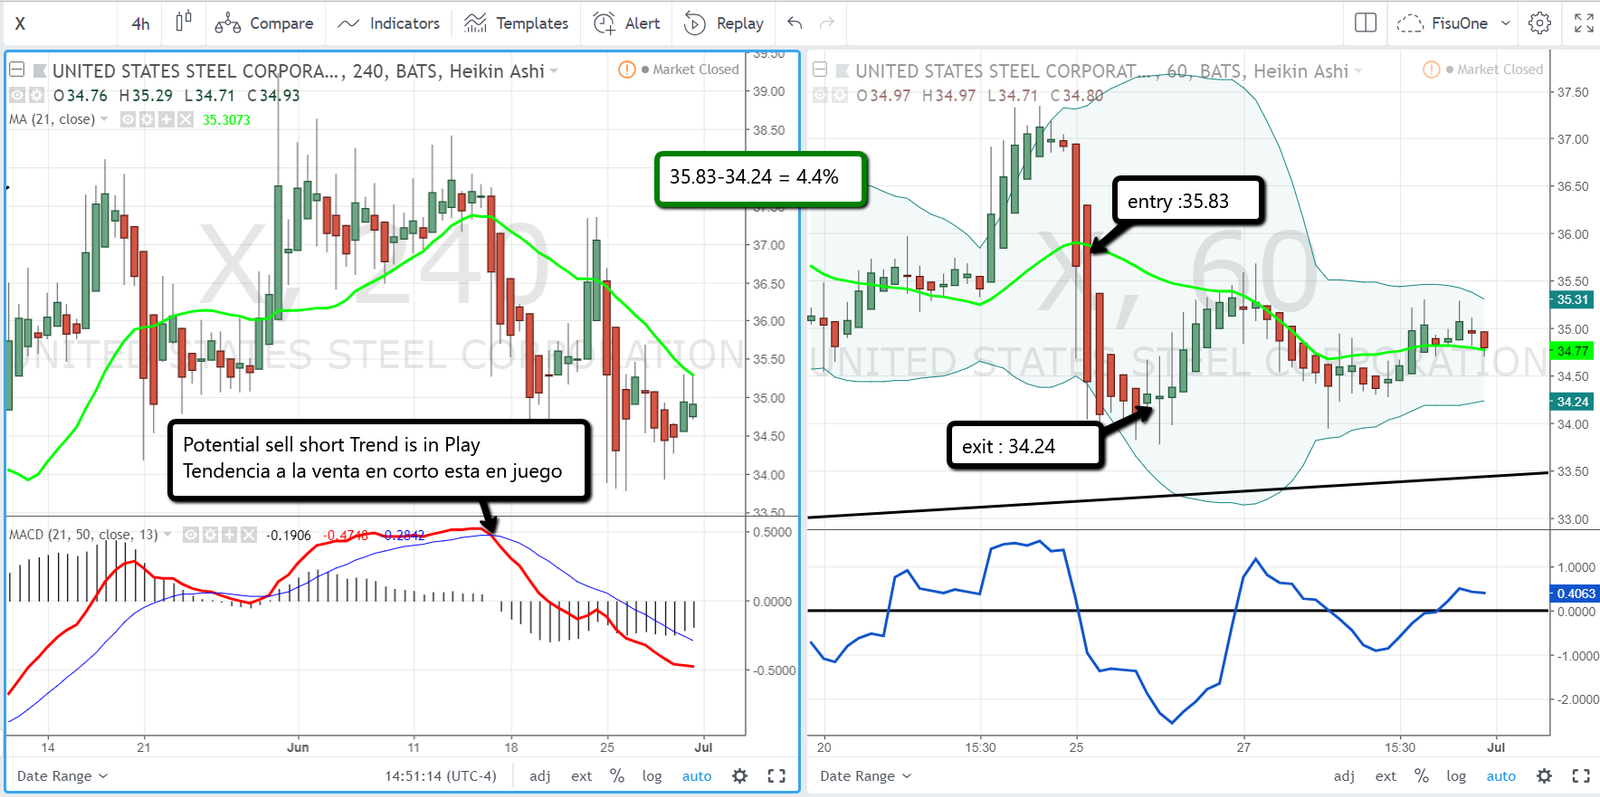
US STEEL (X) presented in the week on the 4hs chart a potential sell short trend when MACD lines crossing to the downside gave this signal, so this crossing that is Red MACD line below blue one is indicating tendency to sell short. Therefore, in the 1hr chart, operations that are short selling must be looked for in the week.
A short sell entry is then produced when X crosses the 21-period green line from top to bottom and the blue momentum line crosses the zero line downwards. This entry is at 35.83 and when the price starts to lateralize the operation is finished you can also wait for it to confirm it when price cross to the other direction the green line. The exit was at 34.24 and the percentage range that left the operation was 4.4%
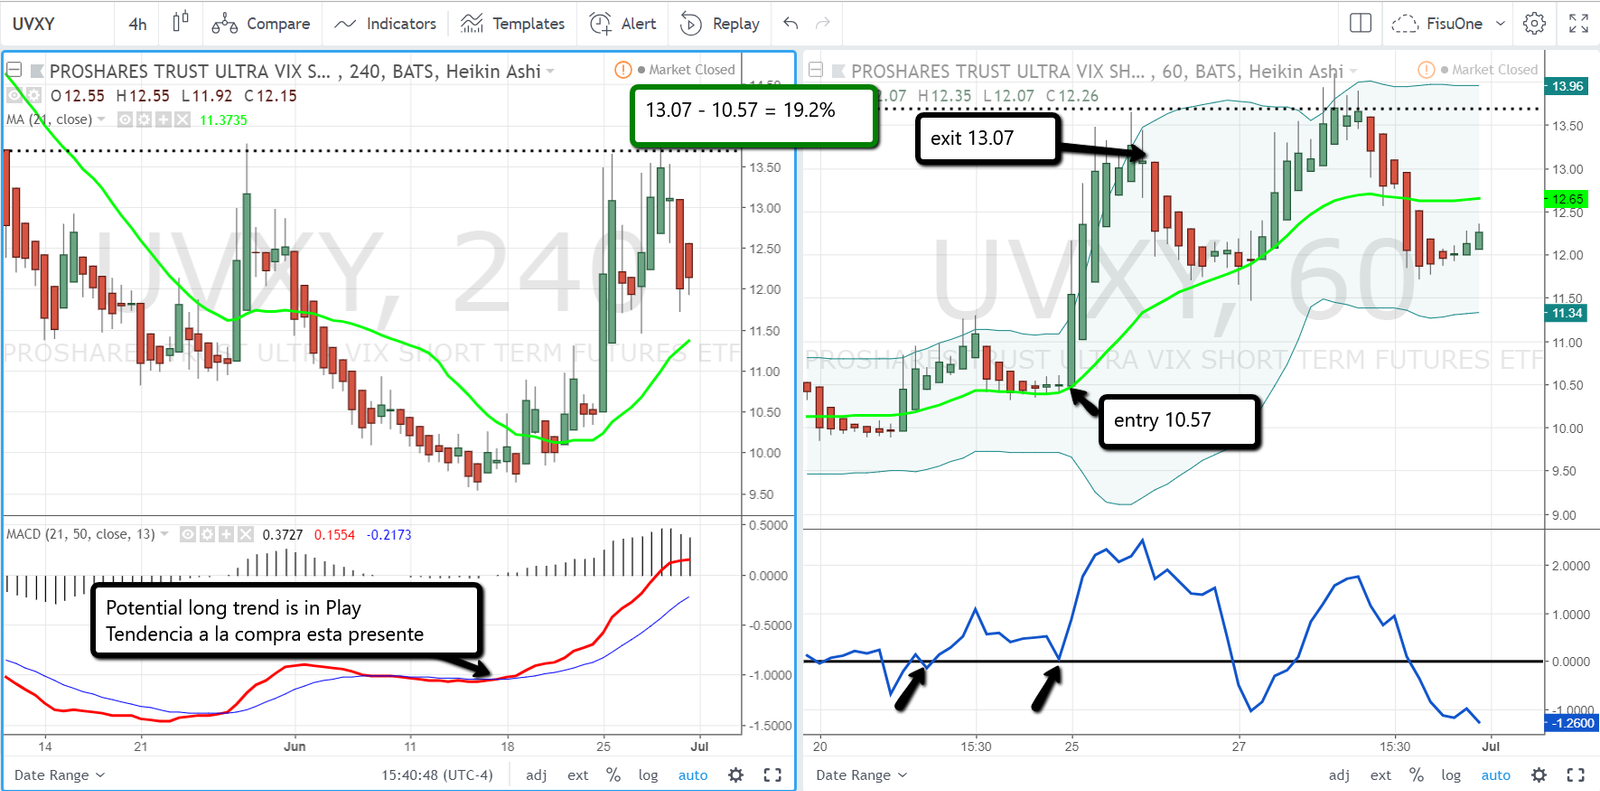
UVXY presented on the 4hrs chart a crossing of MACD lines to the long side. This means that you have to look for operations in the 1hr chart for buying (long). The entry occurs when UVXY crosses the 21-period green line from bottom to top and the blue momentum line crosses at the same time the zero-line from bottom to top. This is indicated by black arrows. The entrance was at 10.57 and the exit when it starts to lateralize at 13.07, it should be noted that this ETF is better to operate very sporadically since it is highly volatile and can cause heavy losses in a short time.
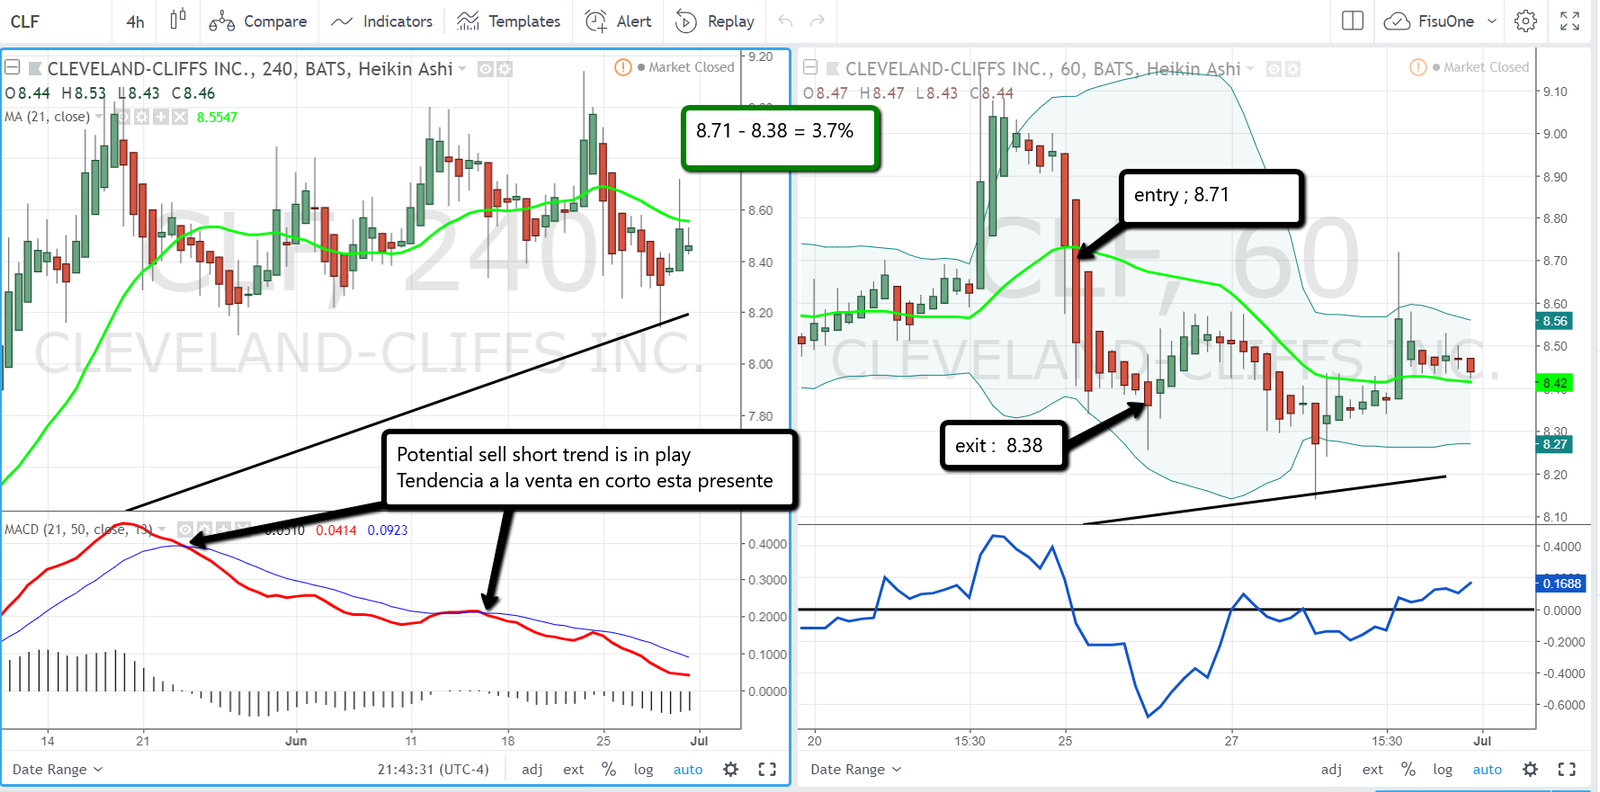
CLF presented in the 4h chart crossing of MACD lines to the downside this is indicating the presence of sell short trend. The entry point was when CLF cuts the 21-period green line from top to bottom and the blue line of momentum goes from top to bottom below zero line that occurs at the 8.71 level and the output when the price loses the trend and starts to lateralize in 8.35. The range of variation in the price of the operation was 3.7%.
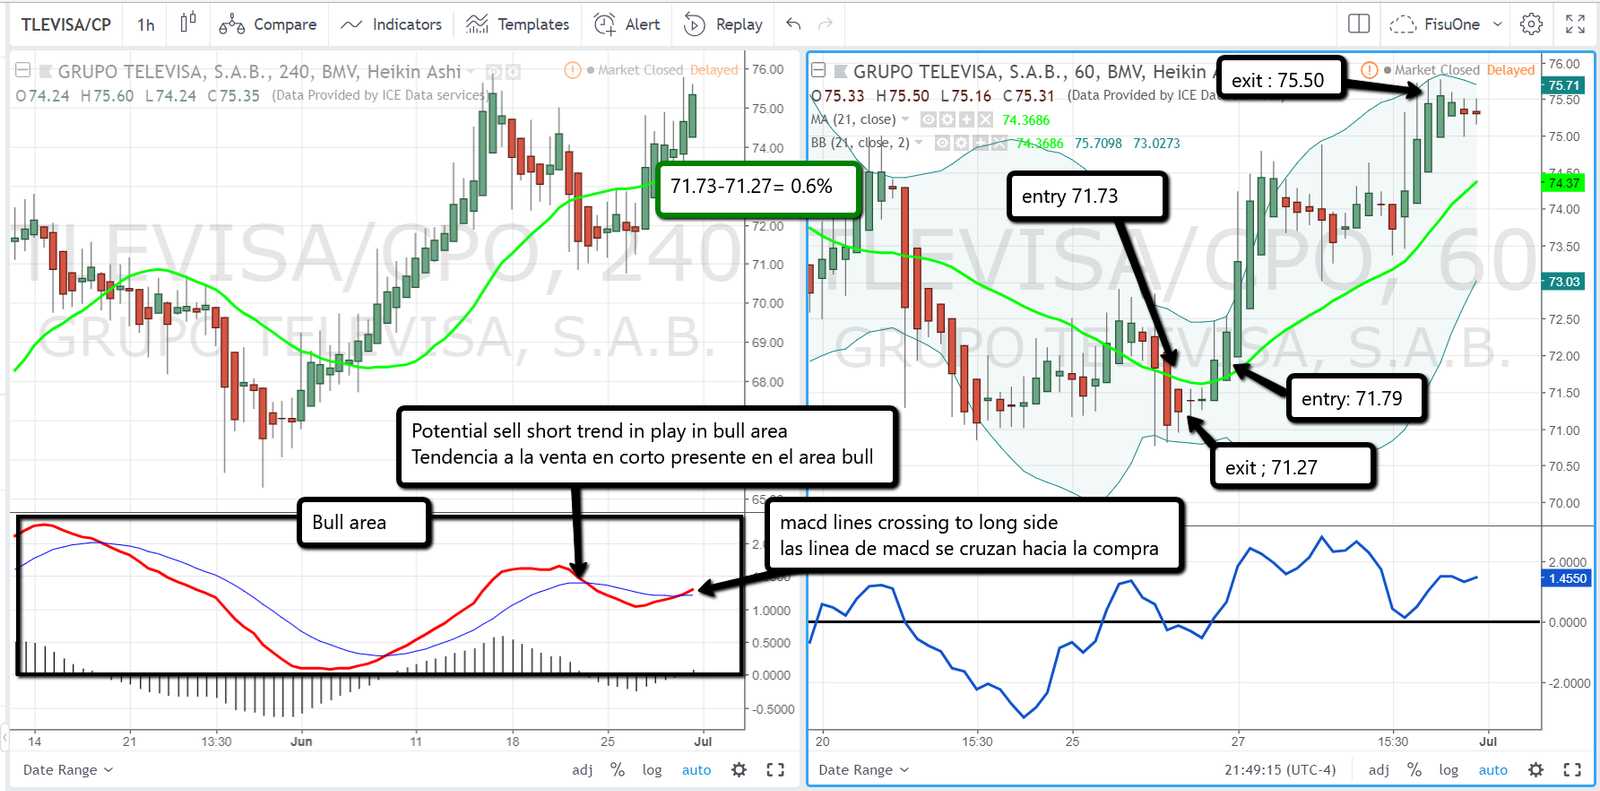
Televisa presented a crossing of MACD lines to the short side, Short selling trend gave the possibility to look for a short sell operation on the 1hr chart, which occurs at 71.73 when TV cuts the 21-period green line from top to bottom, but then quickly goes upwards, if you can perceive this correction in 71.27 that starts to lateralize it is time to exit the trade but it is not perceived, you have to leave when TV cross to the opposite direction the green 21 MA line of 21 periods, but never stay in the trade if the price cross to the other direction the 21 MA green line.
Here it is valid to ask if it could have been operated under the FisuOne® method towards the long side and the answer is yes, if it is already in the MACD of 4 hr in the Bull area as explained in the book, that is when the red line of MACD is above the level of zero is in this long side area but within this area of buying or bull area there are also crosses of MACD lines that indicate potential sell short trends and this is what was observed at the beginning of the week , but the reality is that in this operation, the bull operation would have left more profit than the one that was adopted for short selling. This serves to learn from the method.
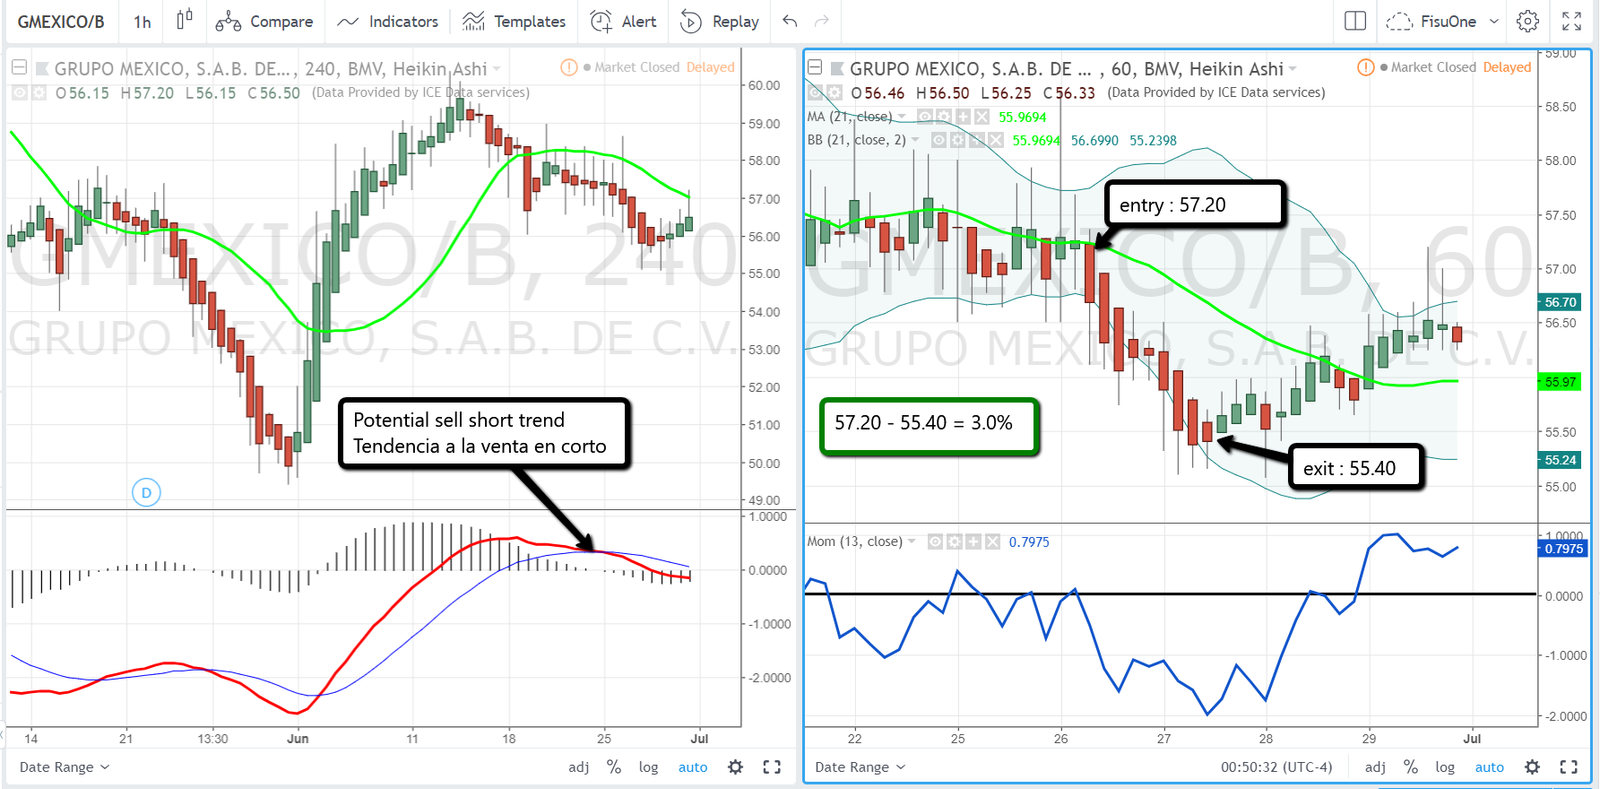
The same as explained in the other examples GMEXICO presented a sell short trend with the crossing of MACD lines on the 4hr chart on the left, then I have to look for sell short trades following this trend, as indicated in the graph on the right where the entry was at 57.17 and the exit at 55.41 giving the price ration a variation of 3%.
Comments are closed here.