Method Description
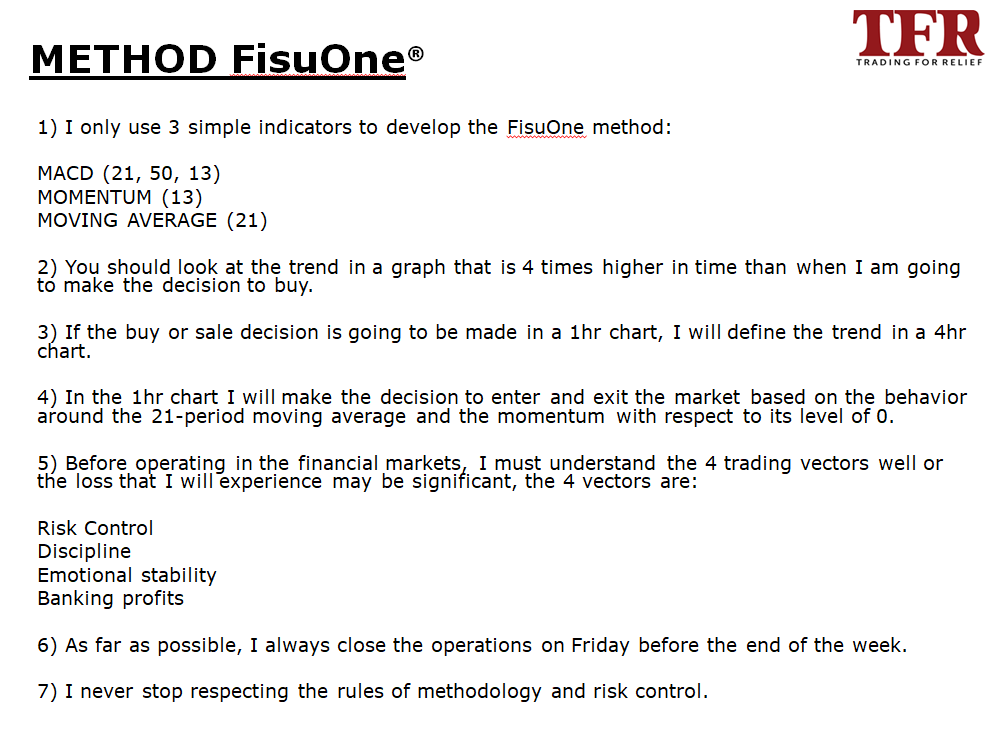
The FisuOne method is based on the concept of identifying the trend of a financial instrument at a time that is 4 times greater than the time where I will make the decision to entry and exit.
This means that if I’m going to look for the entry and exit in a 1hr chart, I will measure the trend in a 4hr chart. Instead, if I’m identifying the entry and exit in a daily chart, this is one in which each bar represents a day, I will look for the trend in a weekly chart.
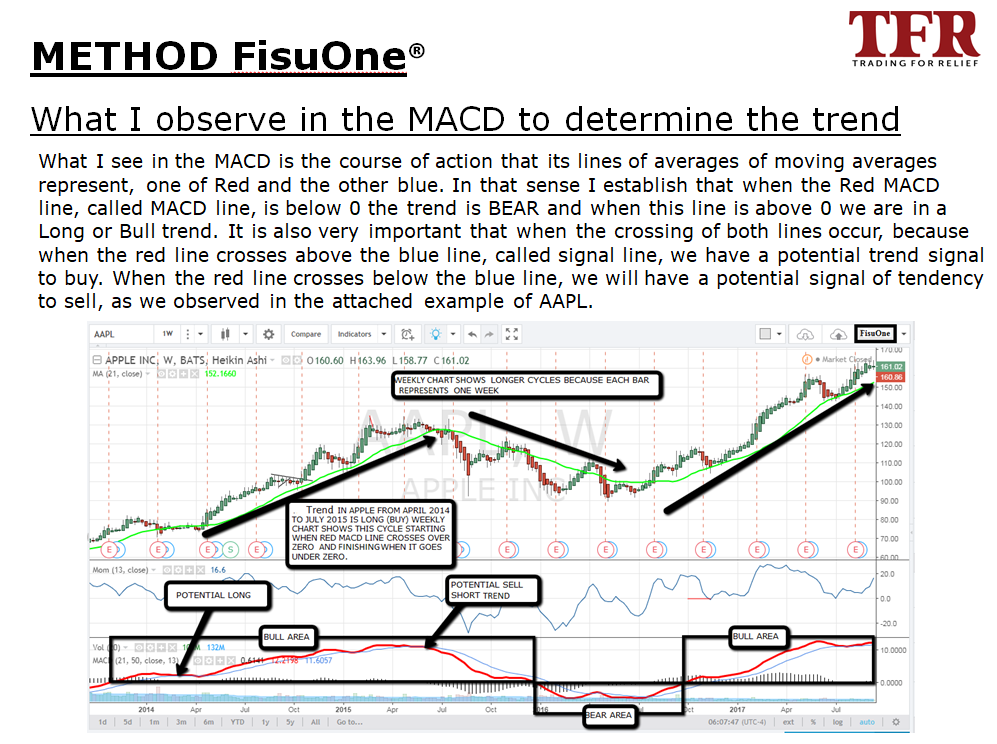
Sell short Trend
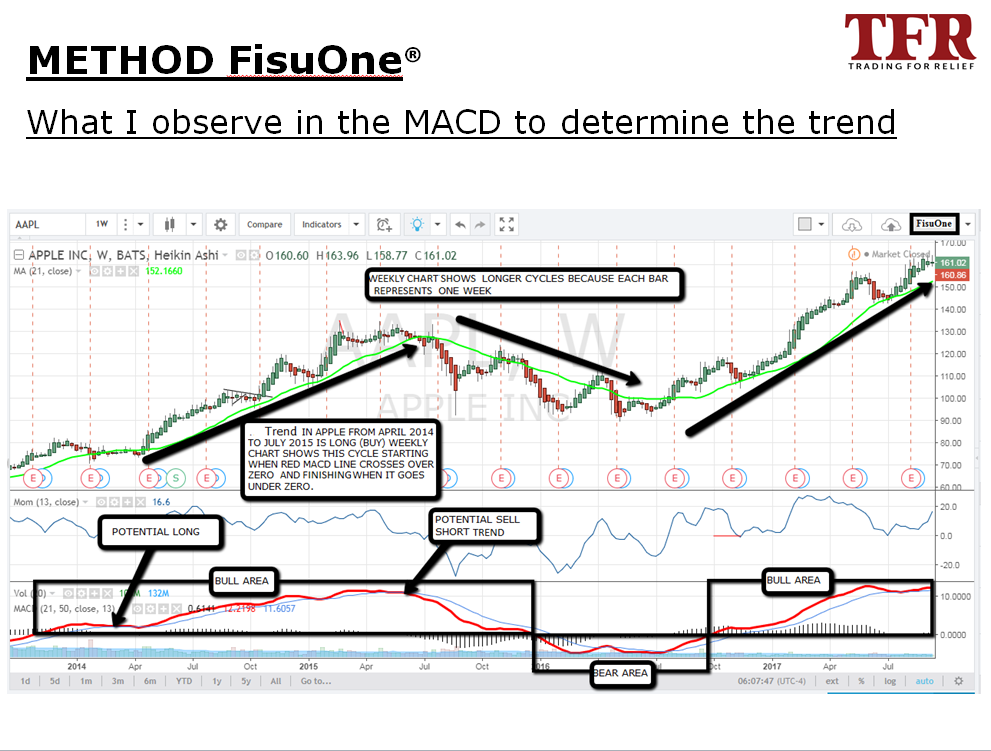
The theory says that if in a 4hr graph or one that is four times with respect to the input graph, the two lines of MACD cross from top to bottom (the red MACD line goes below the blue signal line), I have a potential tendency to sell short. This trend is reinforced when the red MACD line crosses below zero, confirming the weakness of the instrument that is being analyzed.
Long Trend
If the crossing of the MACD lines occurs from bottom to top (when the red MACD line remains above the blue signal line), then I have a potential tendency to purchase or long. This purchase trend is reinforced if the red MACD line continues to rise in such a way that it crosses the line of zero, confirming the strength in the purchase of the instrument being analyzed.
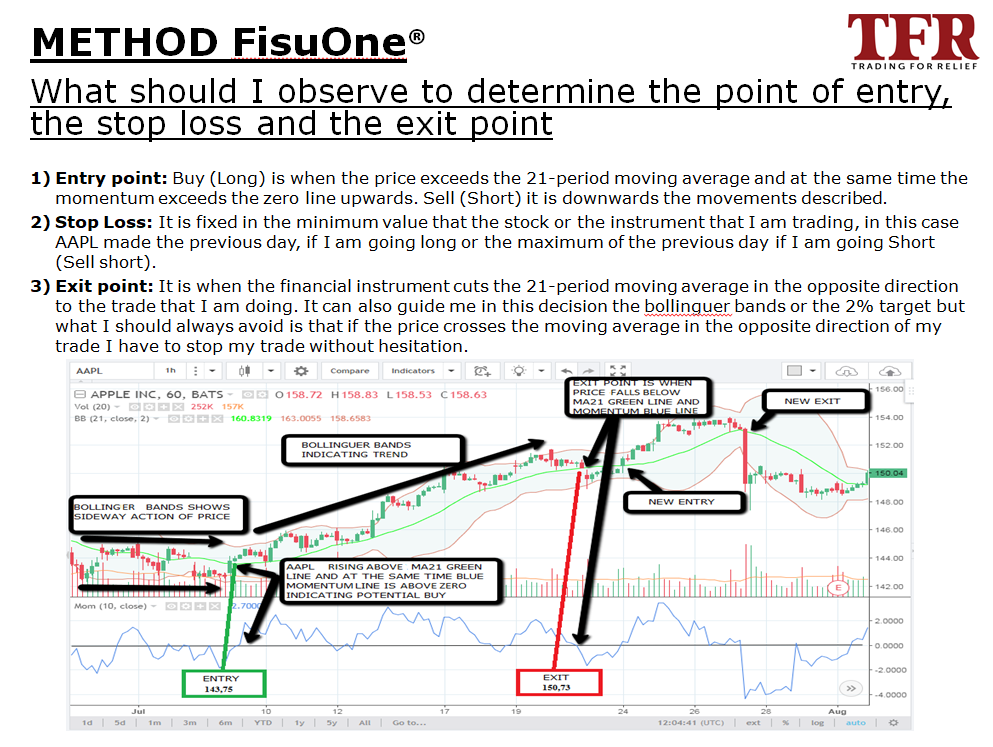
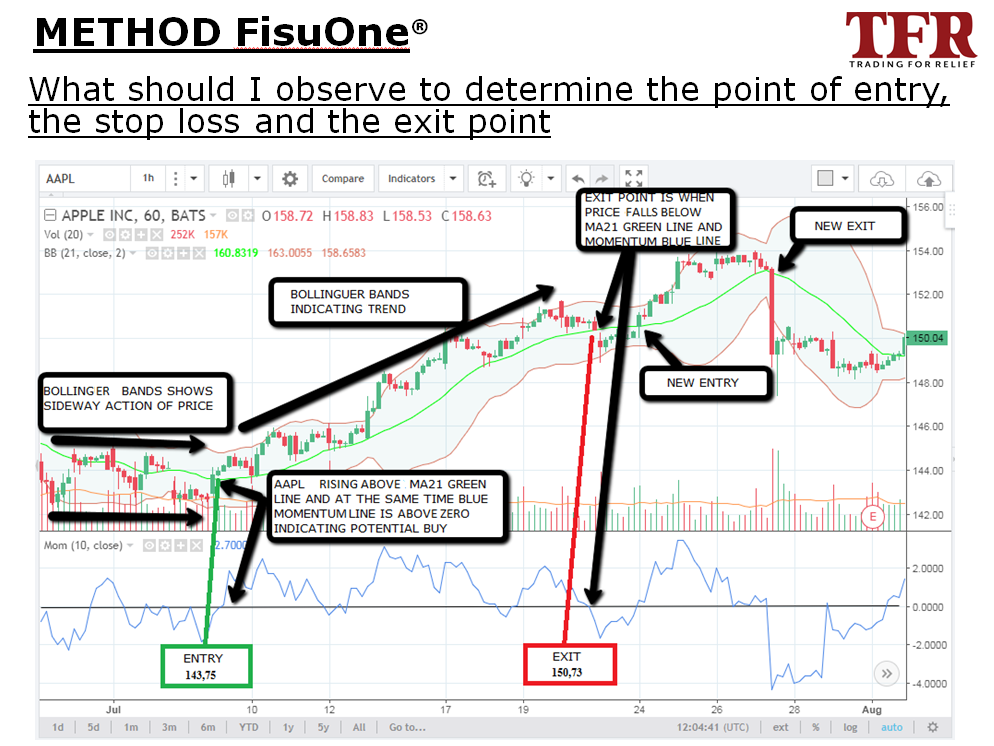
Entry for Buying
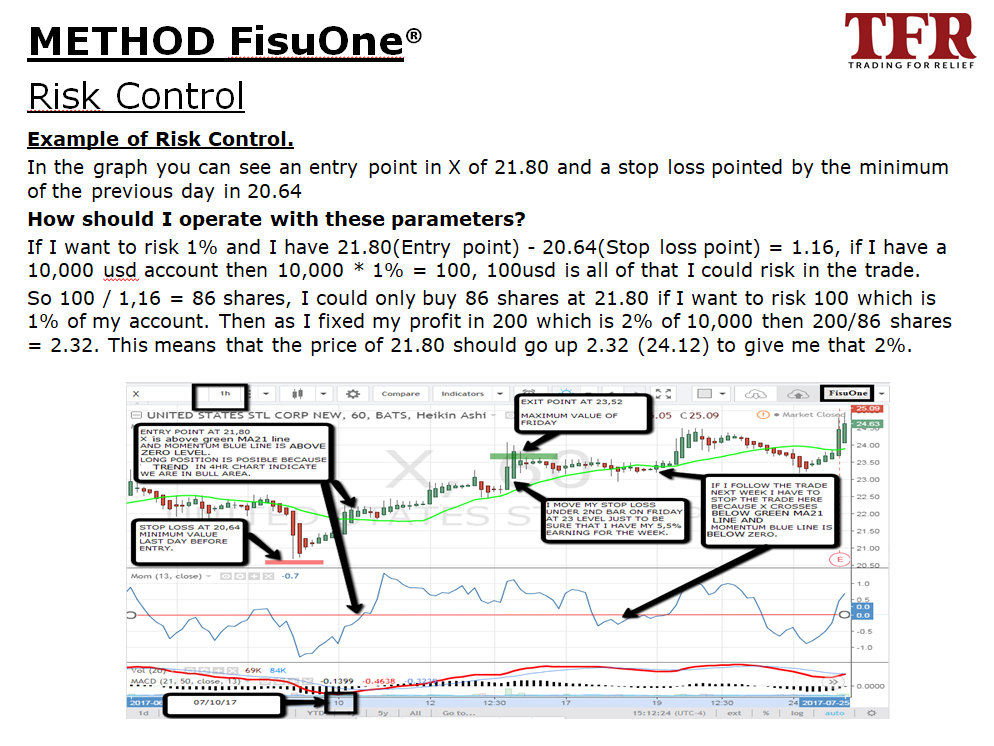
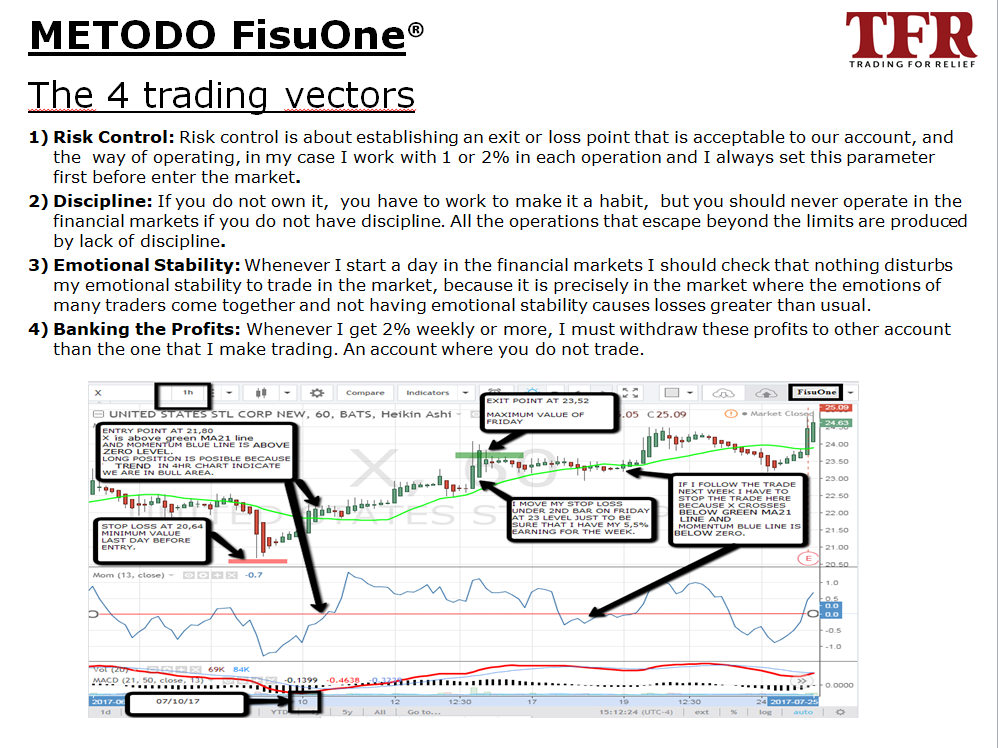
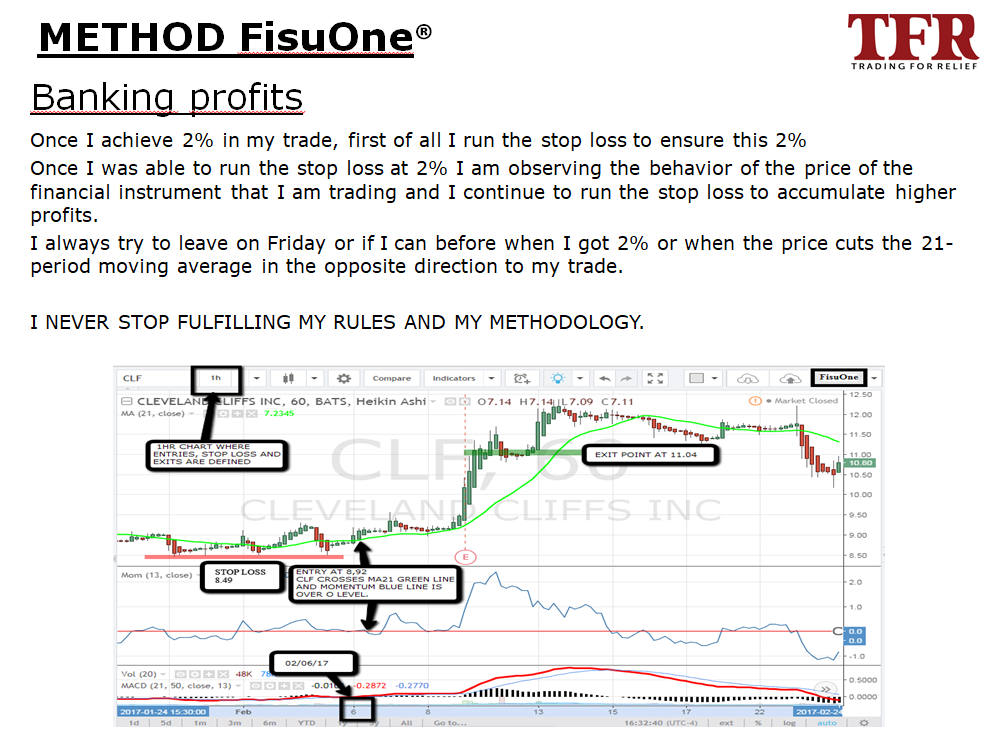
Once I determine the trend in 4hrs, I go to the 1hr chart to observe how the financial instrument behaves in this one. hen if the price cuts the green MA21 line (21-period moving average) from bottom to top, with the momentum moving from the bottom up on the zero line and the trend at that time in the 4hrs chart is long, I have a purchase transaction that can provide me with my weekly profit.
Entry for Sell short
If the price cuts from top to bottom the green MA21 line, and the momentum also moves from top to bottom cutting the zero line at the same moment, it would be indicating a weakness of the price at that moment. Being the trend in a 4hrs potential sale, I have at that point a short sale operation that can provide me the weekly profit I was looking for.
This description can be seen in the presentation attached below and in the graphics that are loaded on the left-hand side of this page.