

Week 01 – 05 April 2019
April 7, 2019 2:33 am| Market | Ticket | Long/Short | Result |
| NYSE | AAPL | Long (Compra) | 4.15% |
| NYSE | FB | Long (Compra) | 5.94% |
These are the trade that I will follow during the week. I comment as an opinion and should not be taken as financial advice. If you have any doubt, read the Terms and Conditions of the site.
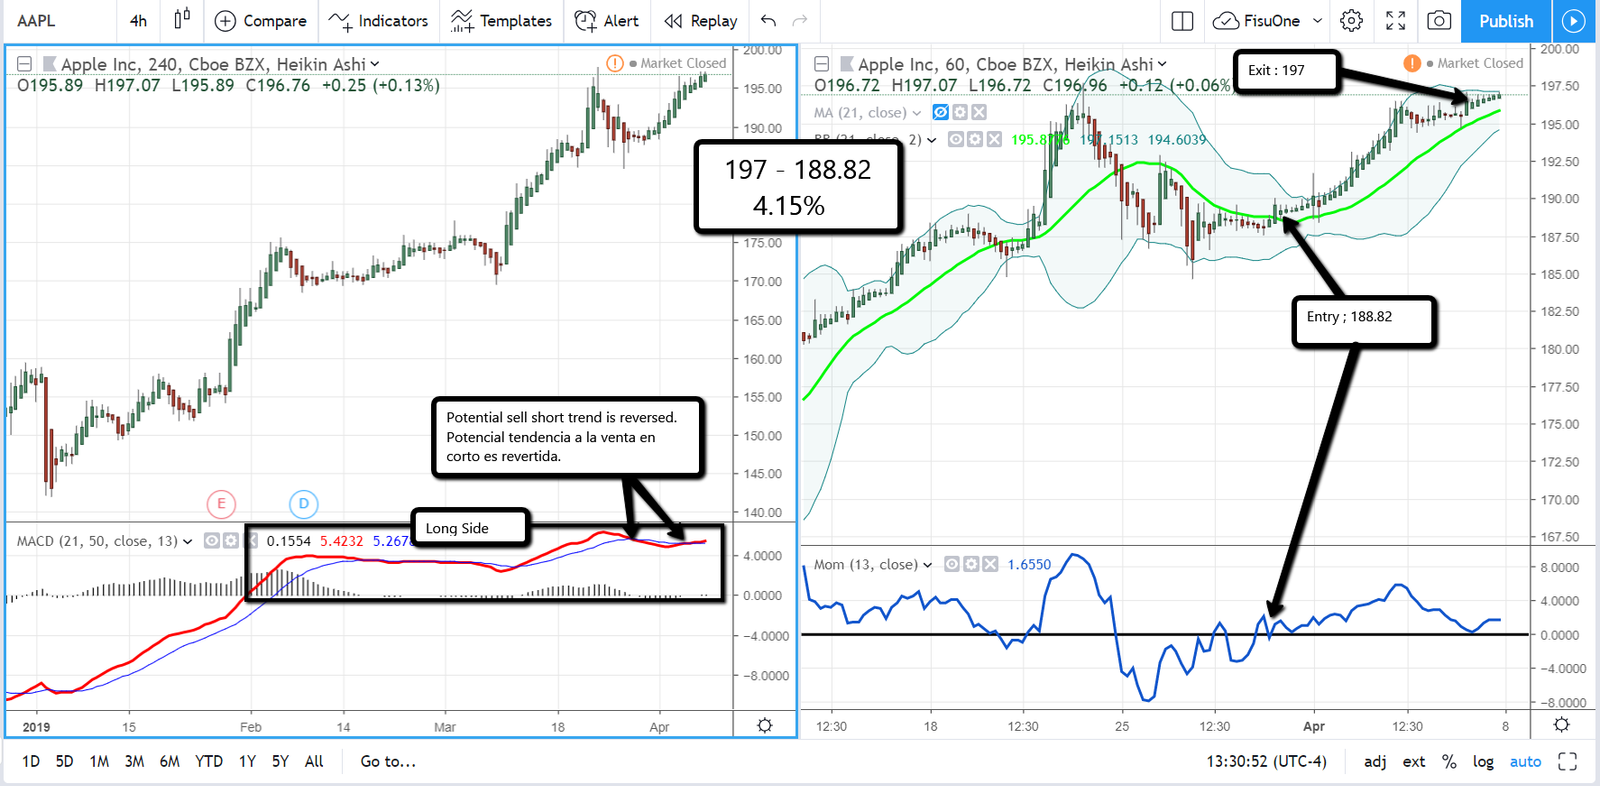
In the last week AAPL give a long trend with the red MACD line above zero in the left 4hr chart but when there is a crossing MACD lines this trend can be transformed into potential sell or long depending on the direction of the crossing of these lines (As explained in the method). Although there was a crossing of MACD lines the previous week towards the potential sell short trend (Red line below the blue one) then it was neutralized because the red line never went below zero and crossed again above the blue indicating strength of the movement to the buying trend, in this context AAPL in the 1hr chart on the right was above the MA21 line at 188.82 and the blue momentum line exceeded the 0 level at the same time indicating moment of force in the price, the Exit occurs on the close of the week when the price is side-lined in 197 giving 4.15% of the trip.
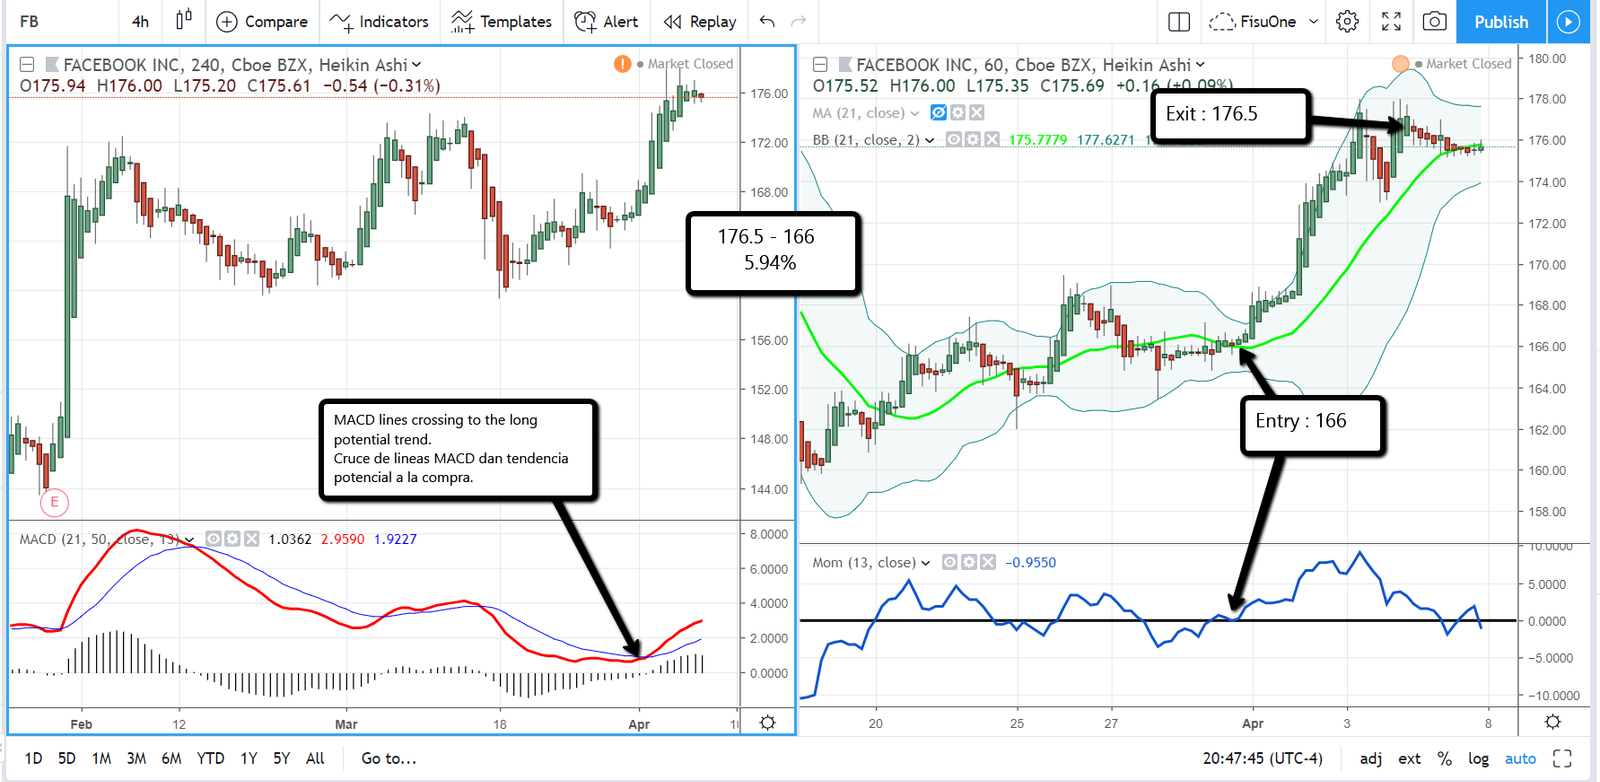
In the last week FB gave a long trend in the 4hr chart on the left with great force in this trend because the red MACD never went below zero. At that moment we must go to the 1hr chart on the right to see if FB is above the green MA21 line and at the same time the blue momentum line is above zero indicates force in the price movement, this is the time to enter the trade at 166 then the exit point is on the last part of the week at 176.5. FB gave a 5.94% run.
Comments are closed here.