

Week 10 – 14 Sep. 2018
September 15, 2018 11:06 pm| Market | Ticket | Long/Short |
| NYSE | X | Long (Compra) |
| NYSE | XBI | Short (Venta en Corto) |
| NYSE | AAPL | Short (Venta en Corto) |
| BMV | CEMEX | Long (Compra) |
These are the trade that I will follow during the week. I comment as an opinion and should not be taken as financial advice. If you have any doubt, read the Terms and Conditions of the site.
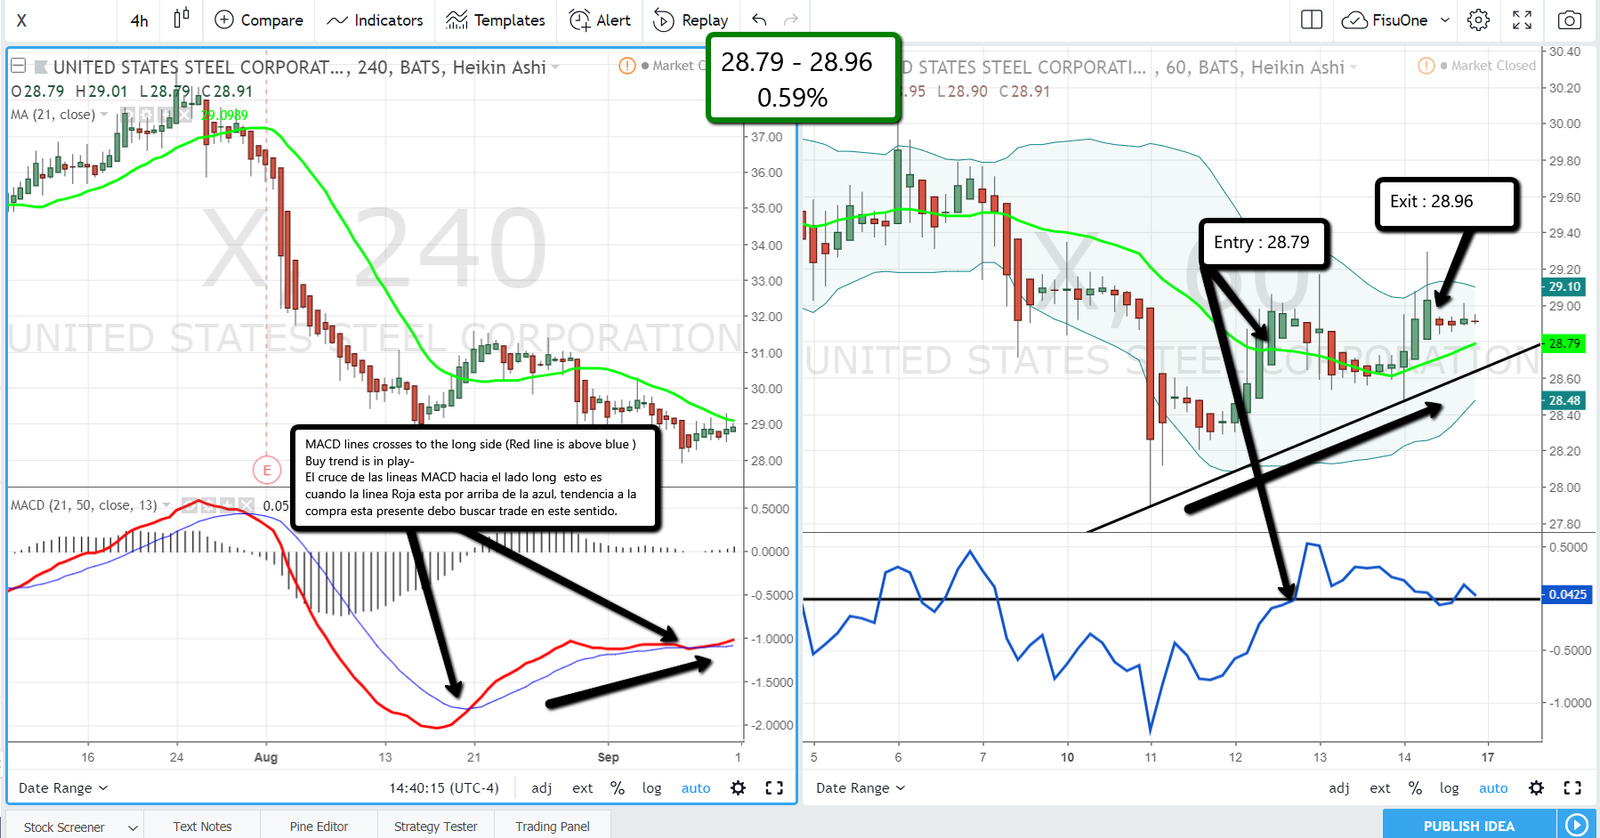
US STEEL gave a signal of potential tendency for buying, in the left graph of 4hr, therefore it is necessary to look for buy trades in the chart on the right of 1hr, as it is indicated in the FisuOne® method, when price moves from bottom to top across the green line MA21 and at the same time the momentum cuts up the zero line.
Entry 28.79, exit 28.96 the profit was not so good but it was not a lost and It generate some gain.
But do not lose sight of the fact that you are in a Bear zone, so you can also consider a bear trade, that is, sell short, which is what can be seen in the 1hr chart before the one indicated in the purchase direction. . This is indicated to learn and see the versatility that the system has if you are attentive.
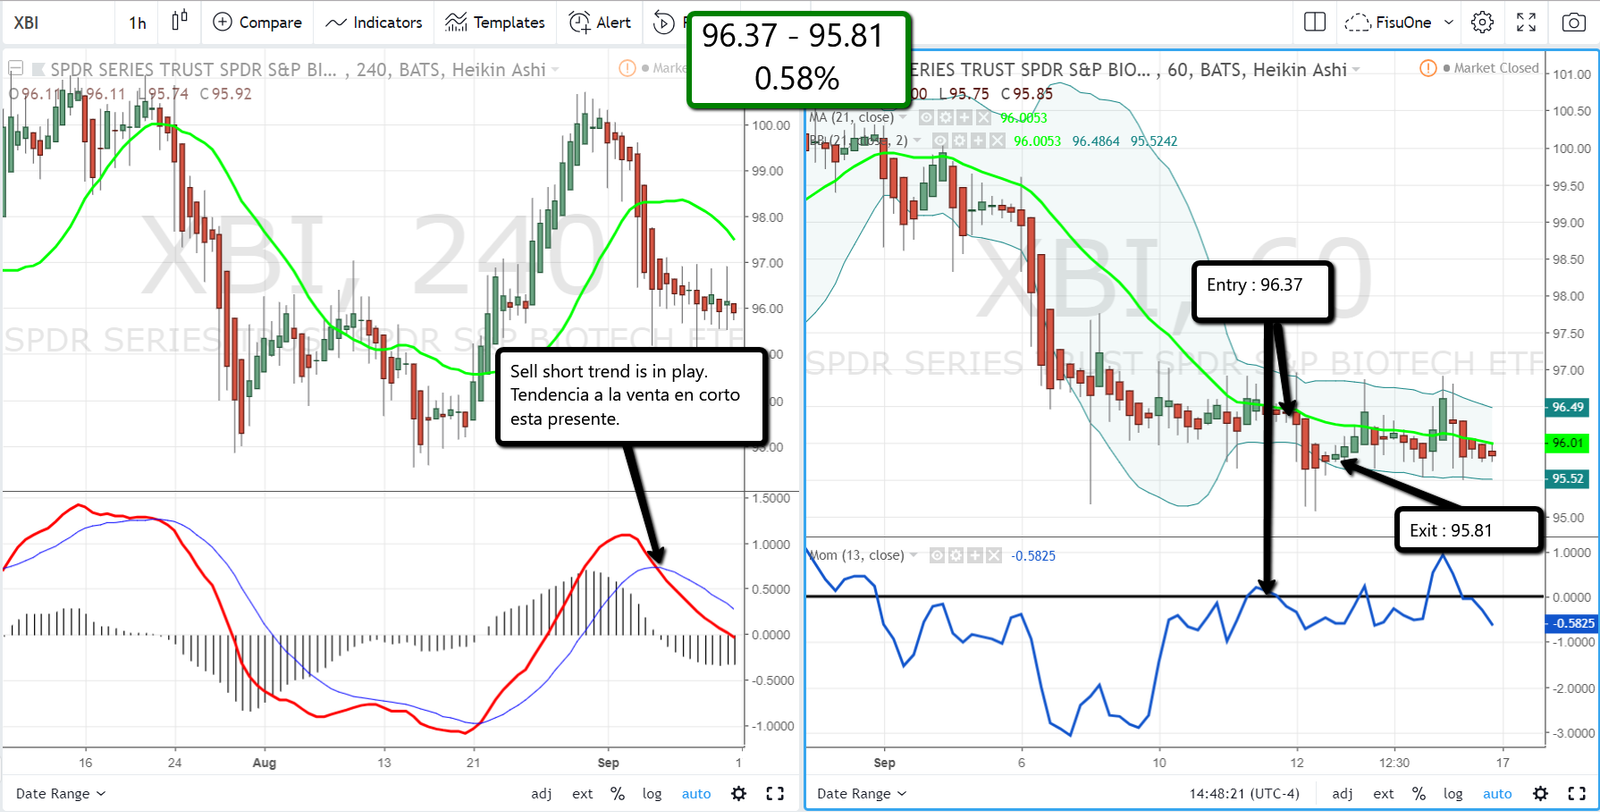
XBI had indicated in the graph on the left. a potential short selling trend for that in the 1hr chart on the right, the idea is to look for sell short tradings and it is given when the price cuts from top to bottom the green line MA21 and at the same time the momentum cuts down the level of zero indicating weakness in the price to grow.
XBI gave a good profit the last week and this week only gave 0.58%, the exit pointt as always arises can be expected to cross in the opposite direction MA21 green line or observe that the price stops going down and lateralizes by which is better to withdraw from the trade.
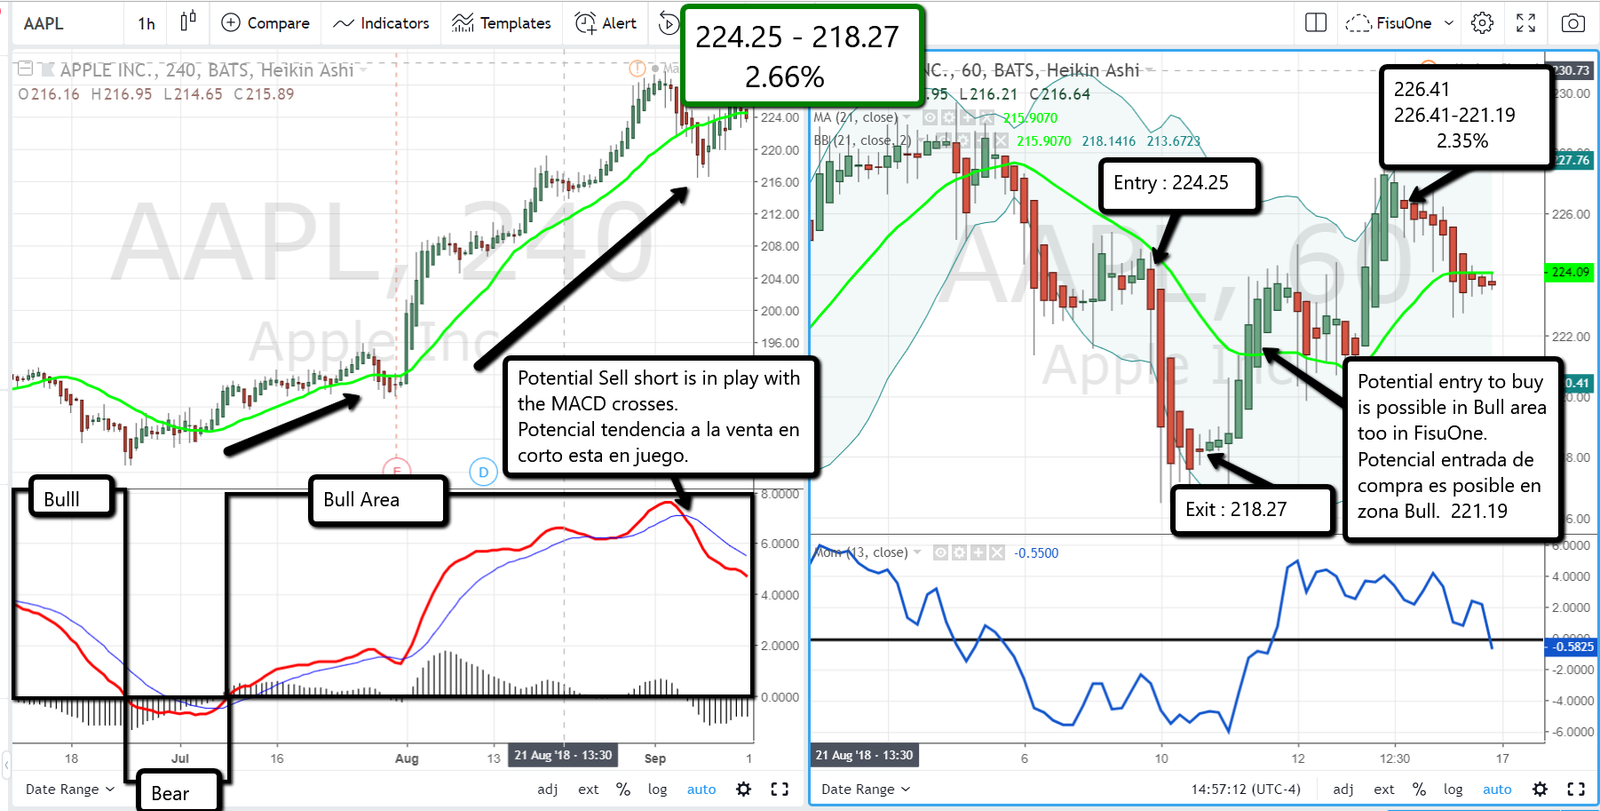
AAPL shows crosses MACD lines down in the 4hrs chart on the left, red MACD line is below the blue one, meaning in the FisuOne® method a potential sell short trend.
The strategy here is to look for sell short trading in the 1hr chart on the right and this occurs when at the level of 224.25 AAPL at the beginning of the week can not overcome the green line MA21 and the moment is still below from zero indicating weakness of the price that Monday, September 10, which taking advantage of this weakness we could make 2.66% in the week.
The system is very versatile and the rest of the week you could look for a buy trade since AAPL in 4hr is in the BULL area as indicated in the graph. So if this had been taken advantage of on Tuesday the 11th there was an buy entry at 221.19 and an exit on Friday when the price lateralized at 226.41, getting an additional 2.35% in the same week. Not bad by the way.
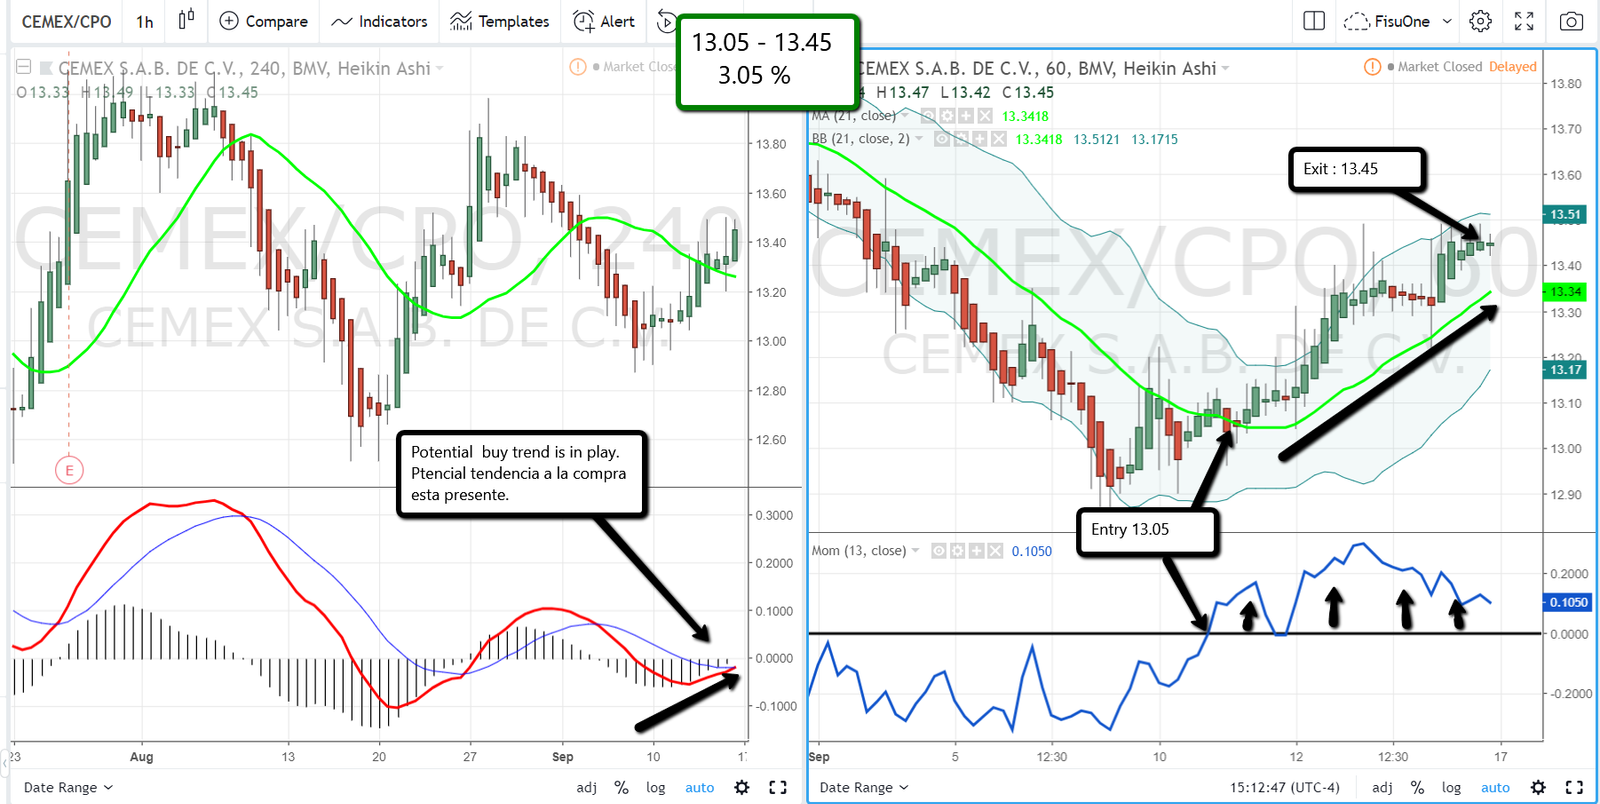
Cemex set a potential buying trend in the 4hr chart on the left, so the strategy was to look for buying trades in the 1hr chart on the right side, the same occurred on Tuesday when Cemex cut from bottom to top the green line MA21 and the momentum crossed the line from zero upwards at the same time indicating strength in the price, the entry occurred at 13.05 and the exit on Friday when the price starts to lateralize.
This operation in the Mexican stock exchange was the one that gave more in the week 3.05%. It should be noted that this company also has a ticket on the NYSE that can be followed and it is CX
Comments are closed here.