

Week 23 – 27 July 2018
July 29, 2018 8:46 pm| Market | Ticket | Long/Short |
| NYSE | TSLA | Long (Compra) |
| ETF | XBI | Short (Venta en Corto) |
| ETF | UVXY | Long (Compra) |
| BMV | GFNORTE | Short (Venta en Corto) |
These are the trade that I will follow during the week. I comment as an opinion and should not be taken as financial advice. If you have any doubt, read the Terms and Conditions of the site.
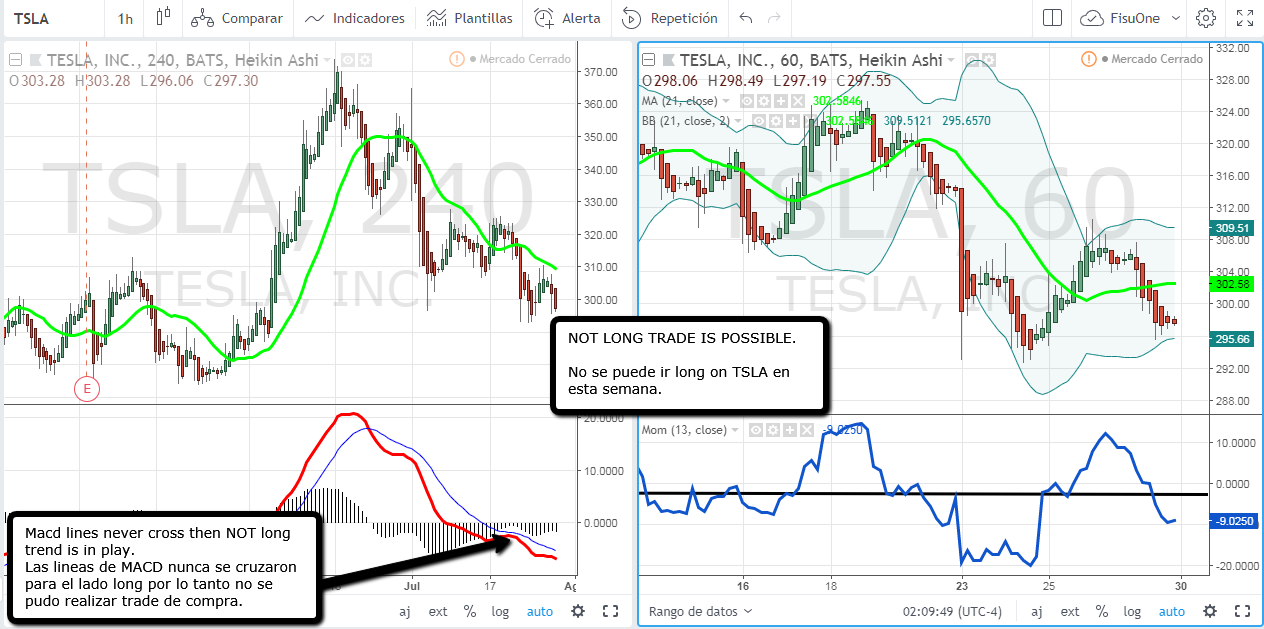
The MACD lines were never crossed in the left graph of 4hr, a necessary condition that enables a buy trend so if this was not fulfilled you can not go with a buying trade in the week.
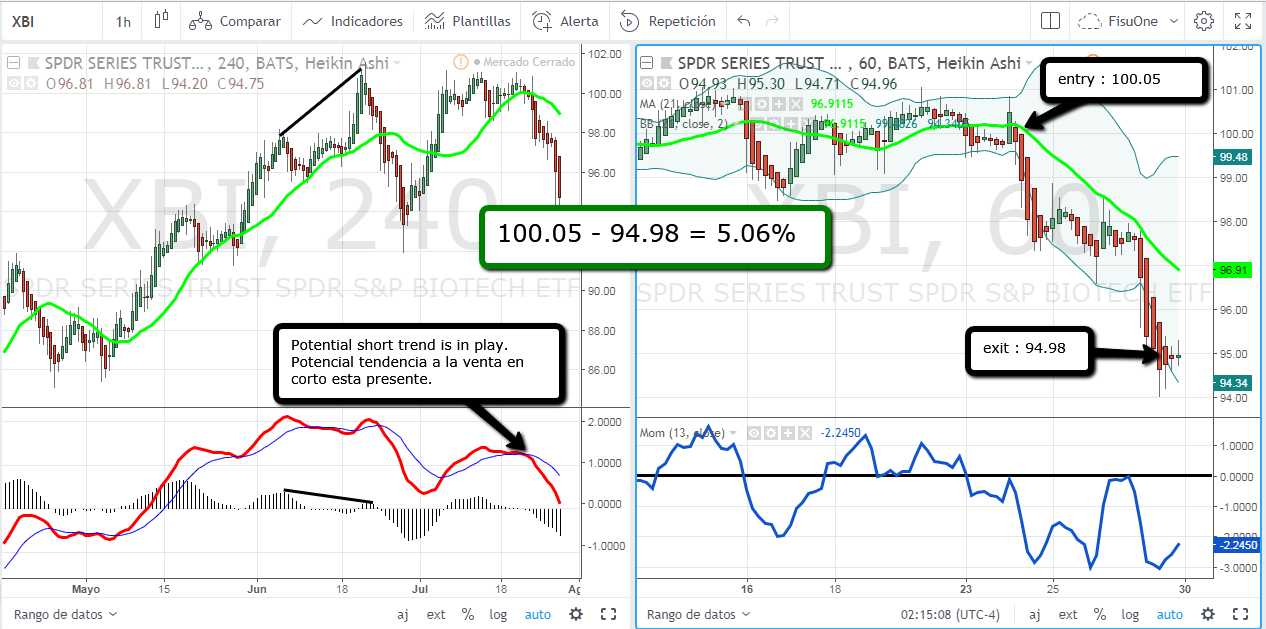
XBI showed a potential short selling trend on the 4hr chart on the left, this is manifested by the MACD crossing, which is why you should look for short selling operations on the 1hr chart on the right. The short sale operations in 1hr appear when the price cuts to the green line MA21 and at the same time the blue momentum line cuts down the level of zero. The exit was established on the closing of the week when the price started to lateralize, observe that while the price does not cut to the MA21 green line in the opposite direction, the trade is still active, so Friday was reached with a path of 5.06%.
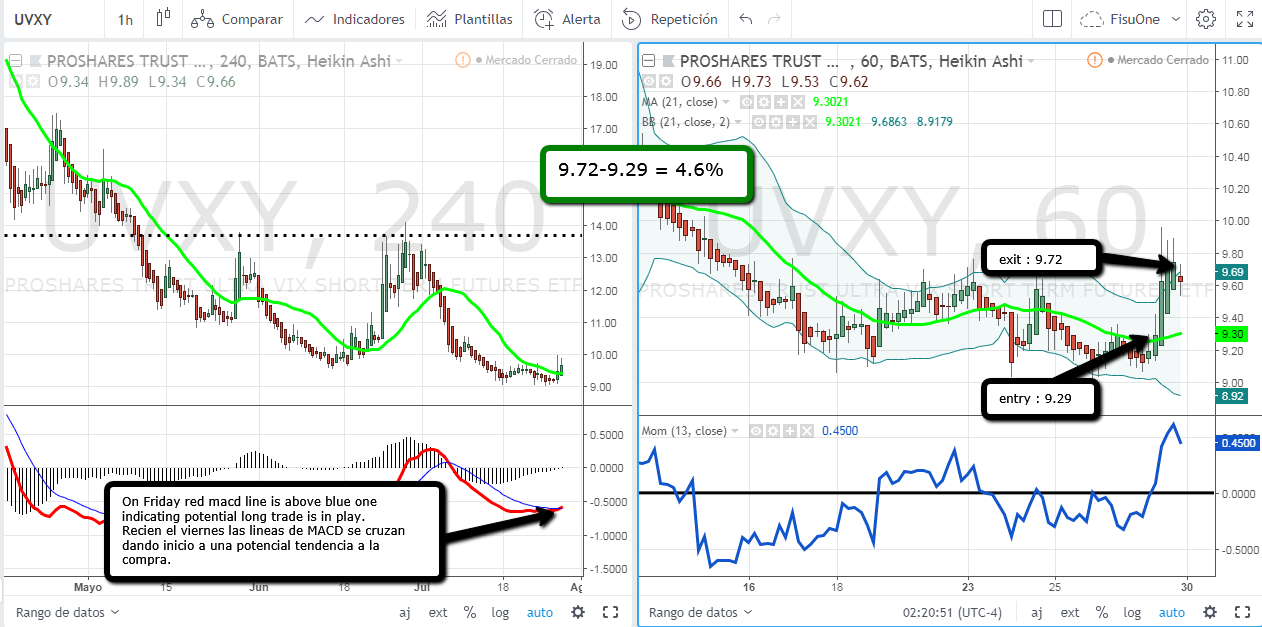
UVXY gave a buying signal just on Friday when the MACD lines crossed, as already explained, this occurs when the red line of MACD crosses above the blue signal line, once established this trend in the left graph of 4hr, we have to look for in the 1hr chart on the right, buying inputs when the price crosses the green line MA21 upwards and at the same time the momentum crosses the zero line from bottom to top. The entry was at 9.29 and the exit was at 9.72 before the close of the market on Friday. The route gave 4.6% in the week.
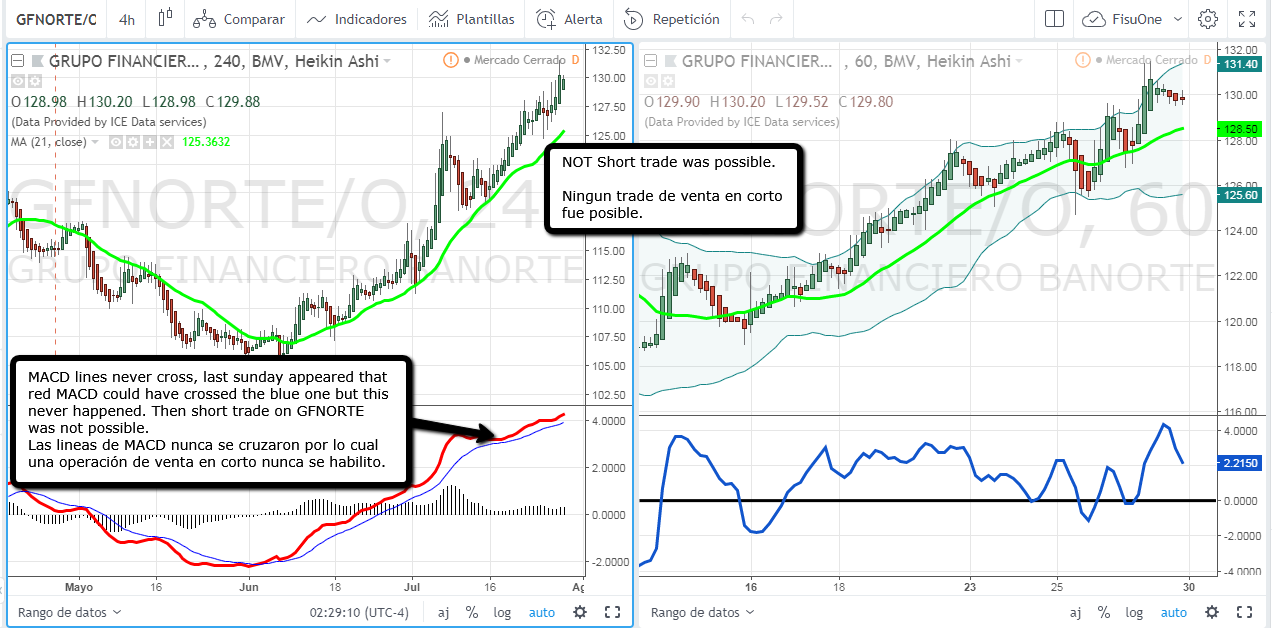
GFNORTE never showed a short sale trend on the 4hr chart, so it was not possible to trade short on the 1hr chart.
Comments are closed here.