

Week 27 – 31 August 2018
August 31, 2018 1:54 am| Market | Ticket | Long/Short |
| NYSE | AAPL | Short (Venta en Corto) |
| NYSE | XBI | Long (Compra) |
| NYSE | USO | Long (Compra) |
| BMV | Walmex | Long (Compra) |
These are the trade that I will follow during the week. I comment as an opinion and should not be taken as financial advice. If you have any doubt, read the Terms and Conditions of the site.
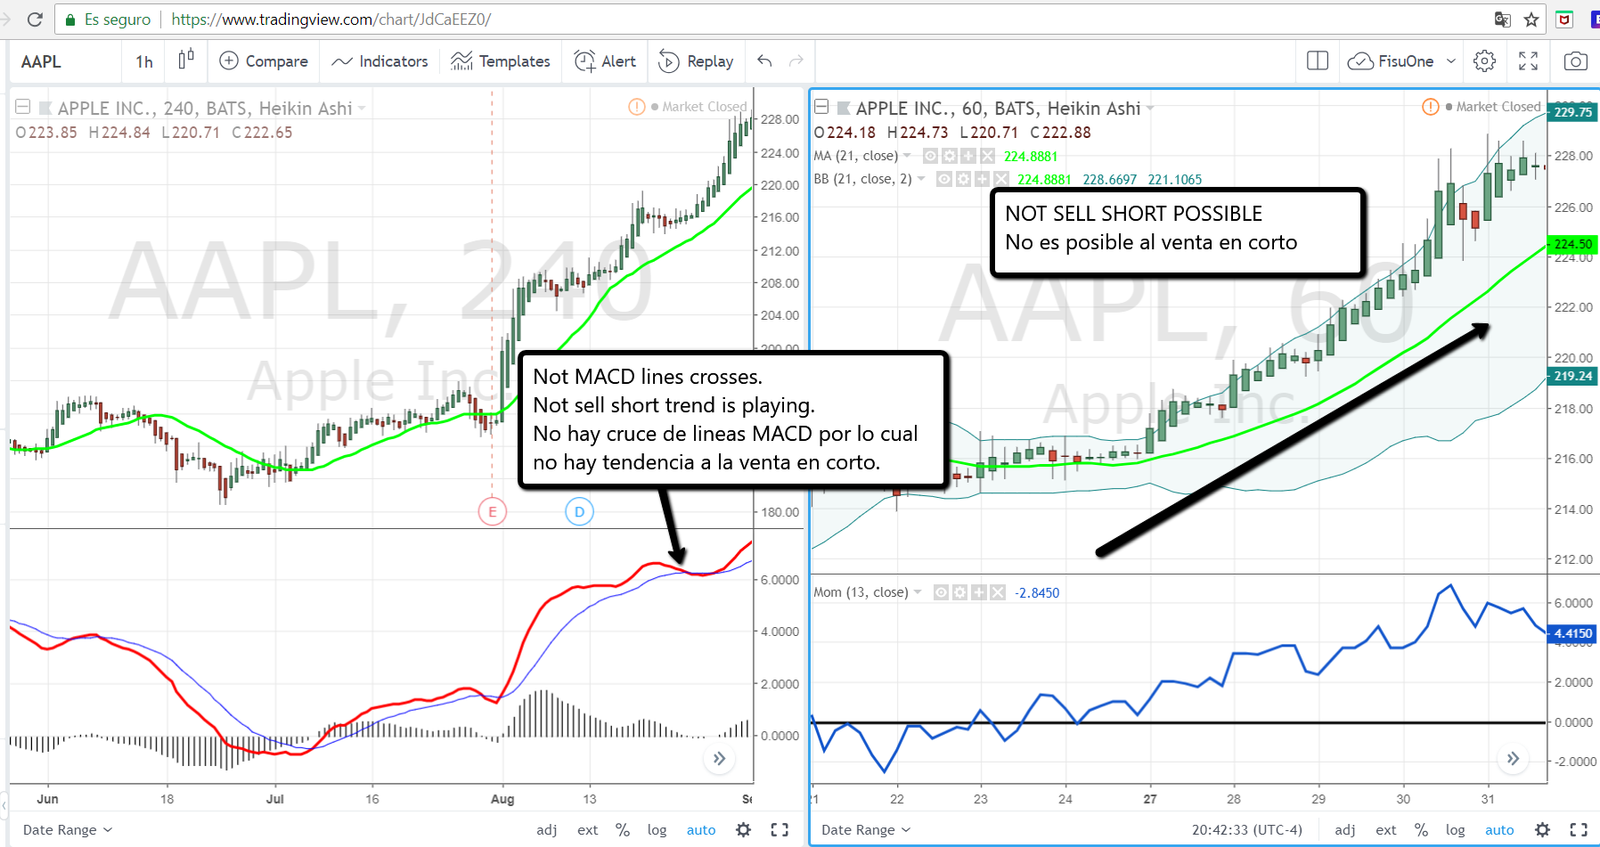
In the week of August 27 to 31 AAPL didn’t show a potential sell short trend because in the 4hr chart its MACD lines didn’t cross downwards, that is Red MACD line is located below the blue line to give a signal of potential trend to the sell short, therefore in this week there was no trade in this regard. Now on the way to learn you can visualize that AAPL in the 4hr chart was in a Bull zone this is when the red MACD line is above the zero level in this area it is possible a trade long or Buy but it was not forecasted or searched but having made the trade buy on Monday 27 at 215.50 and the exit on Friday at 228 giving 6% following all the parameters of FisuOne® method explained in my book and on this website.
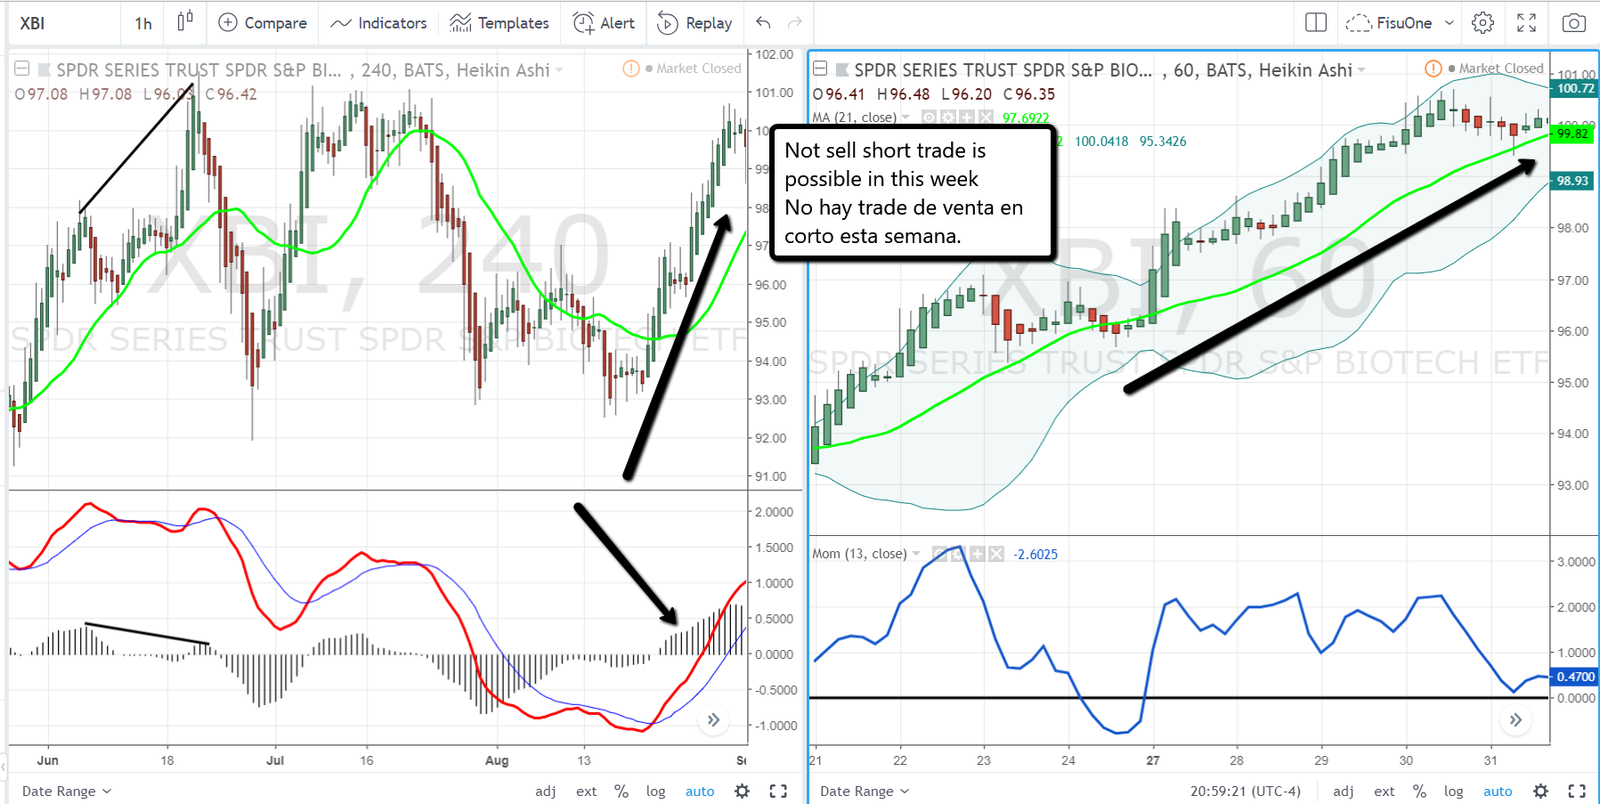
Same case as with AAPL, XBI did not give a sell short trend due to the lack of crossing of the MACD lines in 4hr chart, so that short sale trading can not be done.
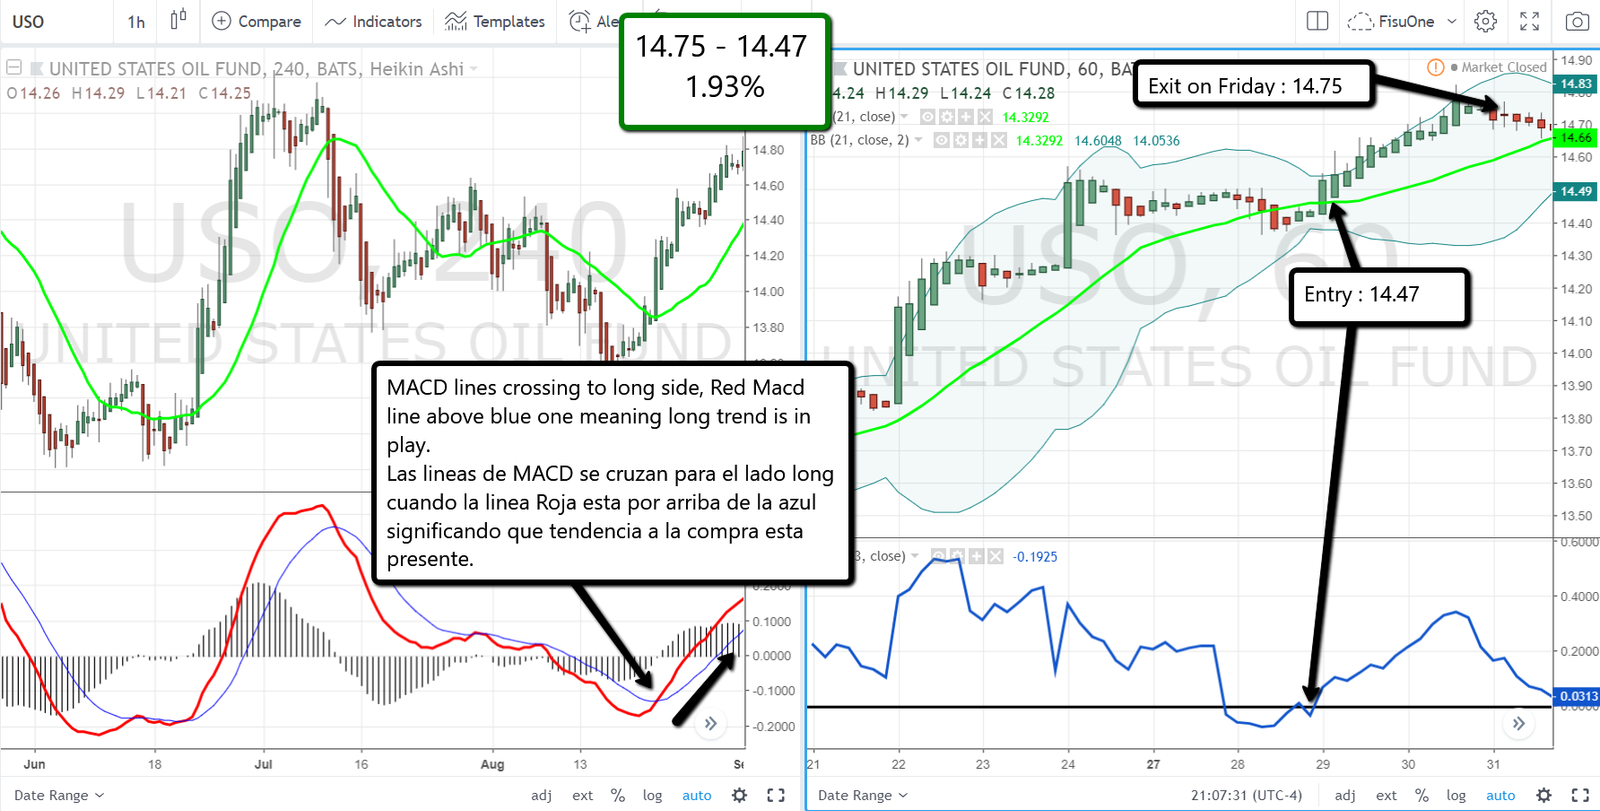
In the case of USO, it was shown in the 4hr chart on the left, crossing of MACD lines with the red line above the blue line, then we go to the 1hr chart on the right, and we look for USO crosses the green MA21 line and at the same time the momentum line crosses the zero level indicating strength in the long way and establishing the entry point at 14.47 and the exit point with the arrival of Friday and the lateralization of the price at 14.75 giving this trade in the week 1.82%.
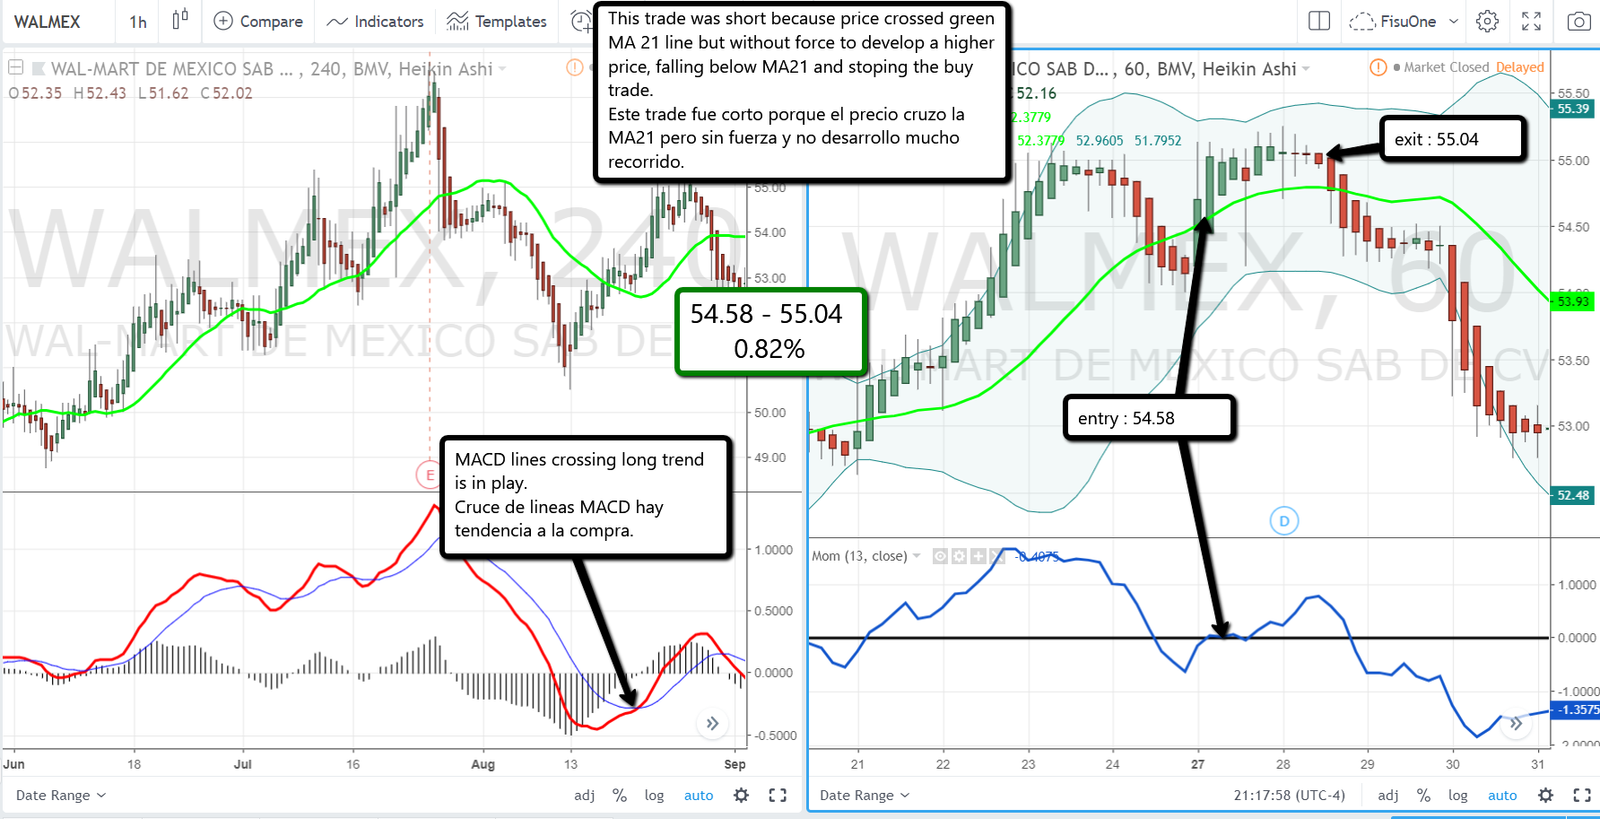
Walmex stock quoted on the Mexican stock exchange gave us a potential trend to buy in the 4hr chart, so in the week it remained to find the entry point and the exit point to go long or what is the same to buy this stock.
In the 1hr chart on the rightr. Once Walmex cuts the green MA21 line from below to above and the momentum crosses the zero level, the entry point is reached. But in this trade you have to observe that Walmex is not very strong at the buy and starts to lateralize and in the 2nd red bar it is better goes out the trade at 55.04.
It is valid to stay in the trade but when you observes that the price is going in the opposite direction to the green MA21 line you must be removed immediately out the trade to not lose with it. The exit at the opposite intersection would have been almost at the same entry level if you decided to stay a while longer in the trade.
Comments are closed here.