
Week 4 – 8 June 2018
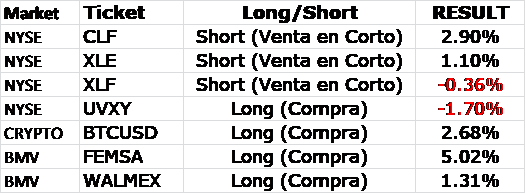
June 13, 2018 1:55 am| Market | Ticket | Long/Short |
| NYSE | CLF | Short (Venta en Corto) |
| NYSE | XLE | Short (Venta en Corto) |
| NYSE | XLF | Short (Venta en Corto) |
| NYSE | UVXY | Long (Compra) |
| CRYPTO | BTCUSD | Long (Compra) |
| BMV | FEMSA | Long (Compra) |
| BMV | WALMEX | Long (Compra) |
*Estos son los Trade que seguiré en la semana. Lo comento como opinión y no deben ser tomados como consejos financieros. Ante cualquier duda leer los Términos y Condiciones del Site.

CLF gave on the 4hr chart in the left where the trend is looking for a trend, appear signal for potential sell short. So you have to look at the 1hr chart on the right for short selling operations and when CLF cut down the green line MA21 and the blue line is below the level zero . Entry at 8.54 and exit when lateralizes the price at 8.29 with a result of 2.9% –
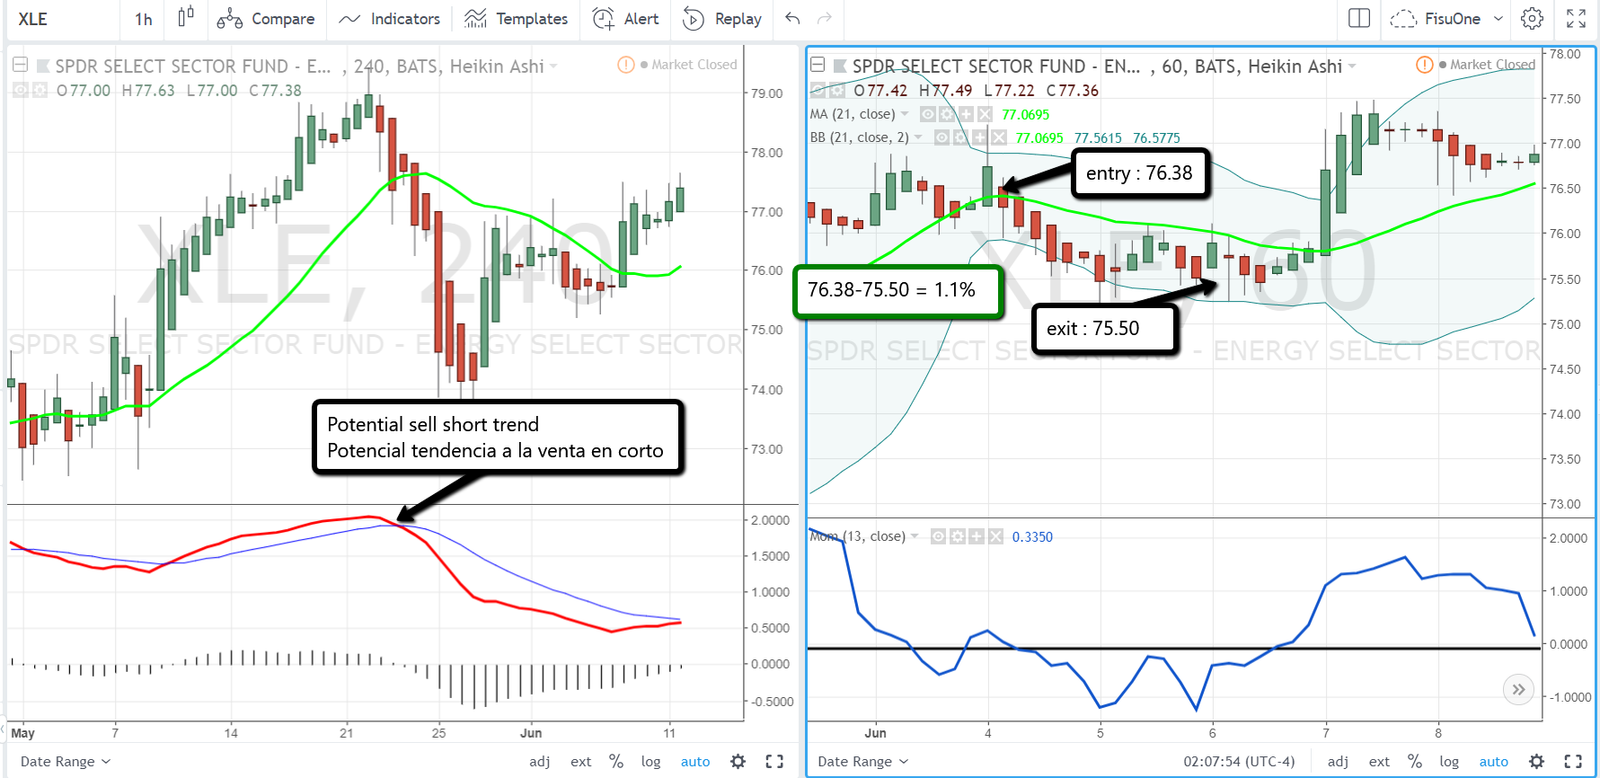
XLE is an ETF of energy and gave a signal of potential short selling in the left chart where the trend is defined. With this marked trend we only look for short selling operations in the 1hr chart on the right, these are given when XLE cuts the green line MA21 and the blue line of momentum crosses the zero line. This operation left 1.1% in the week.
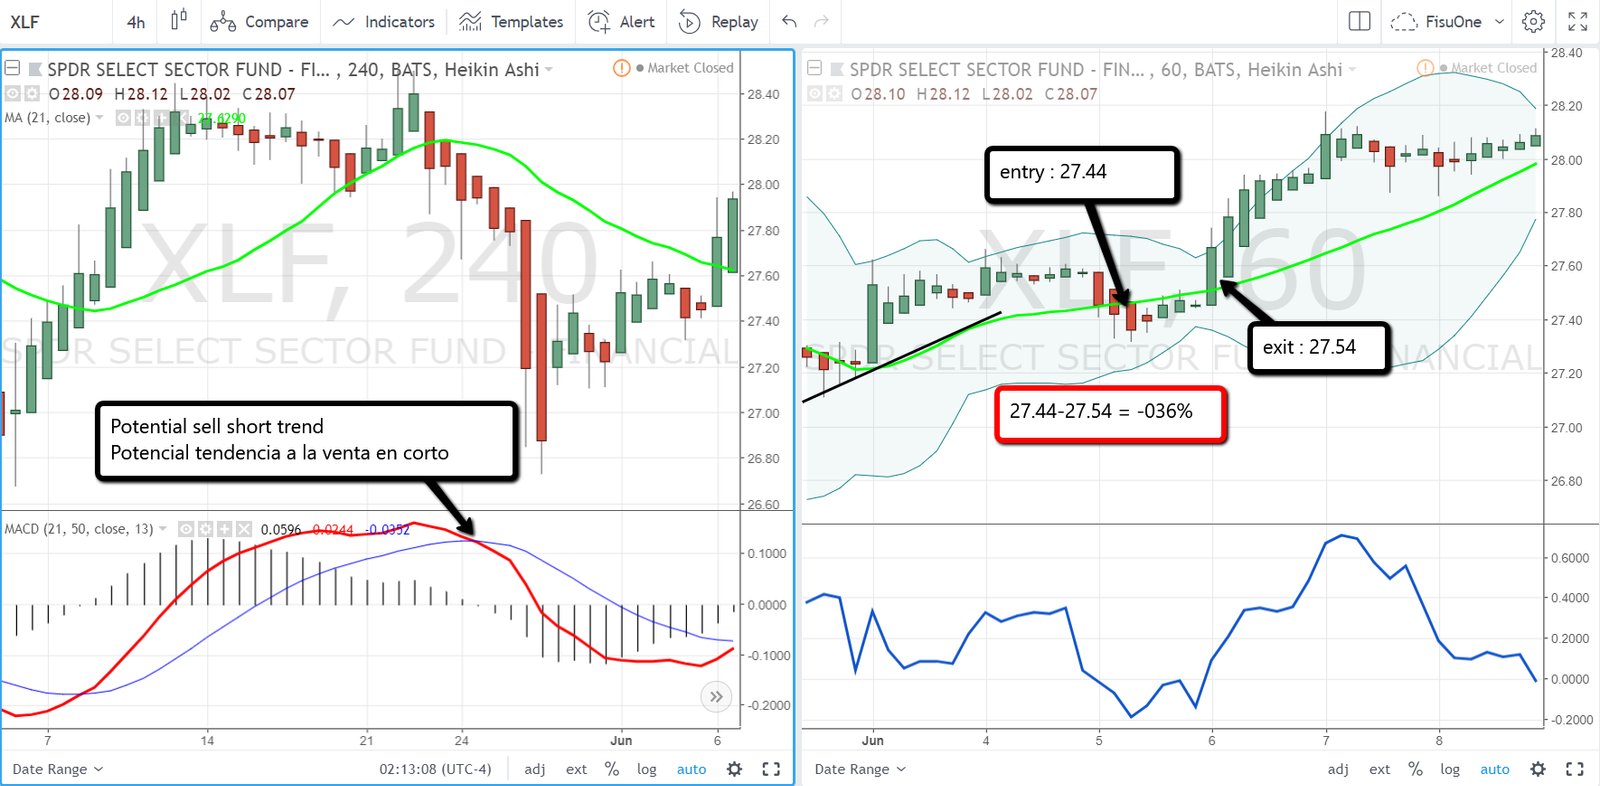
XLF is an ETF that represents financial companies gave a short sell signal in the chart on the left, when the red line of MACD crosses below the blue line, by then it looks for the week in the chart of 1hr operations for sell short, the same occurred when XLF cut down the green line of 21 moving average and the blue line of momentum went below zero in this trade no profit was achieved and 0.36% was lost.
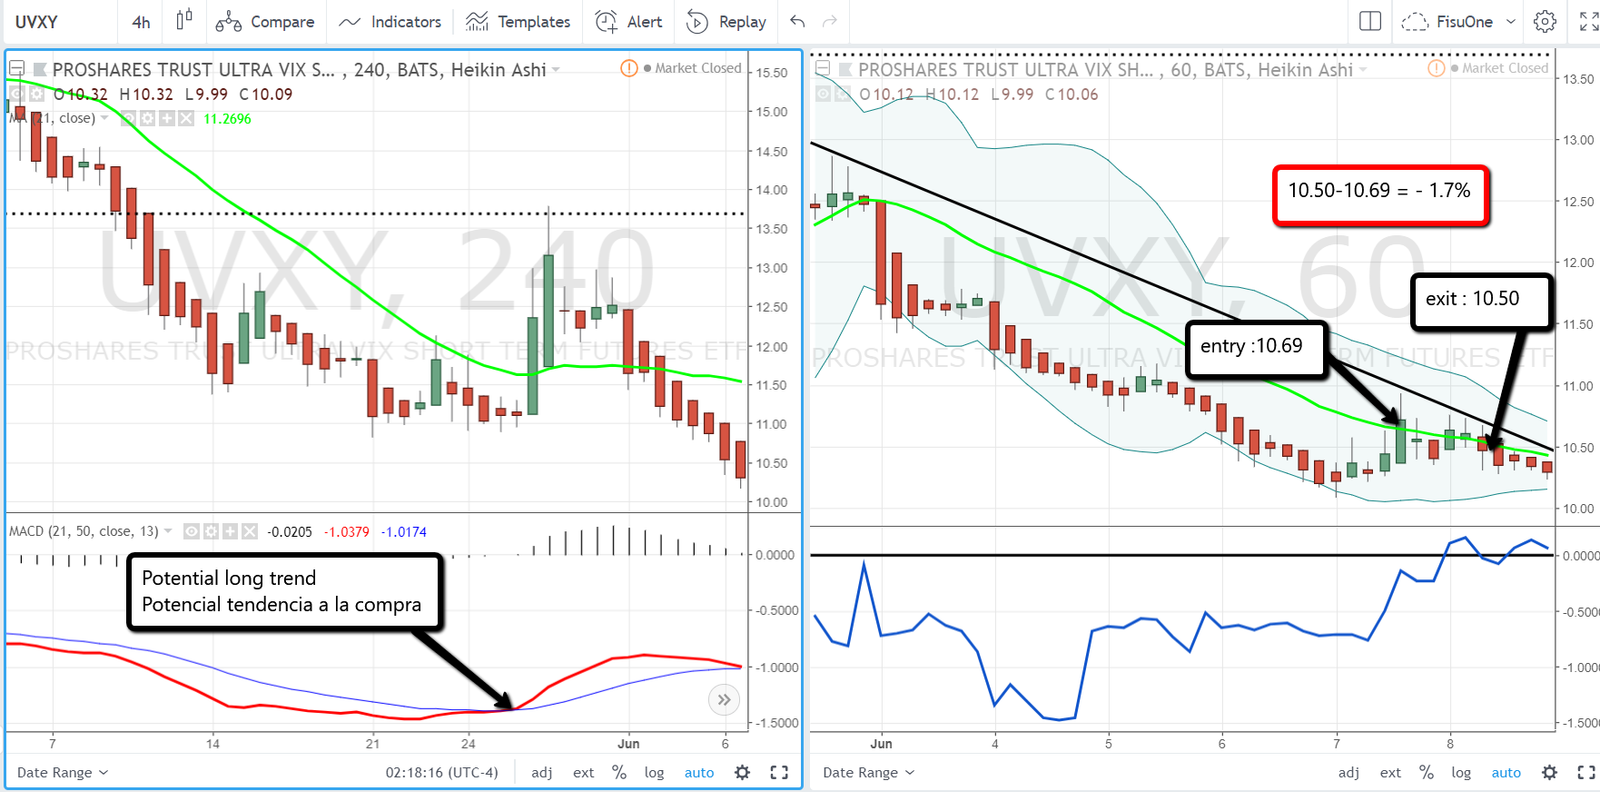
UVXY that moves with the volatility of the market expressed in the VIX gave buy signal at the beginning of the week (With this ETF must be very careful because it is highly volatile) can be seen in the left chart the for buying but when looking for the entry signal in the right chart it was not sustained by going back in the opposite direction to the trade and causing a loss of 1.7%.
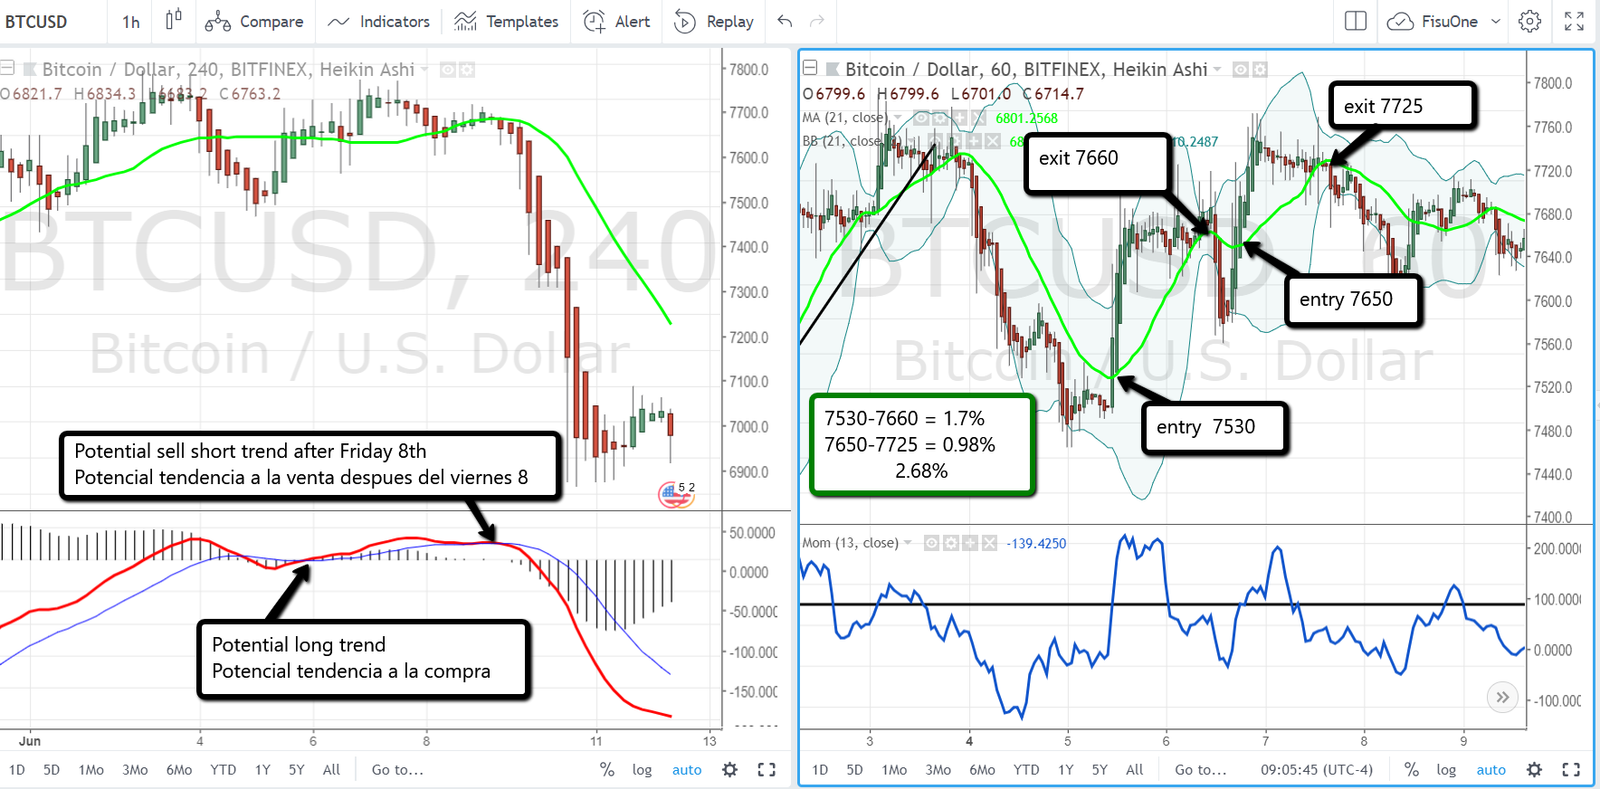
The BITCOIN is a crypto currency that is always giving signals of entry and exit given its high volatility, you always have to operate with stop loss because you can never measure its variations. It gave signal of tendency to buy but on the closing of week it changed that tendency to the sell short for it remarked the high changes of tendency that bitcoin presents. Operations in the week for the purchase were 2 that added 2.68%.
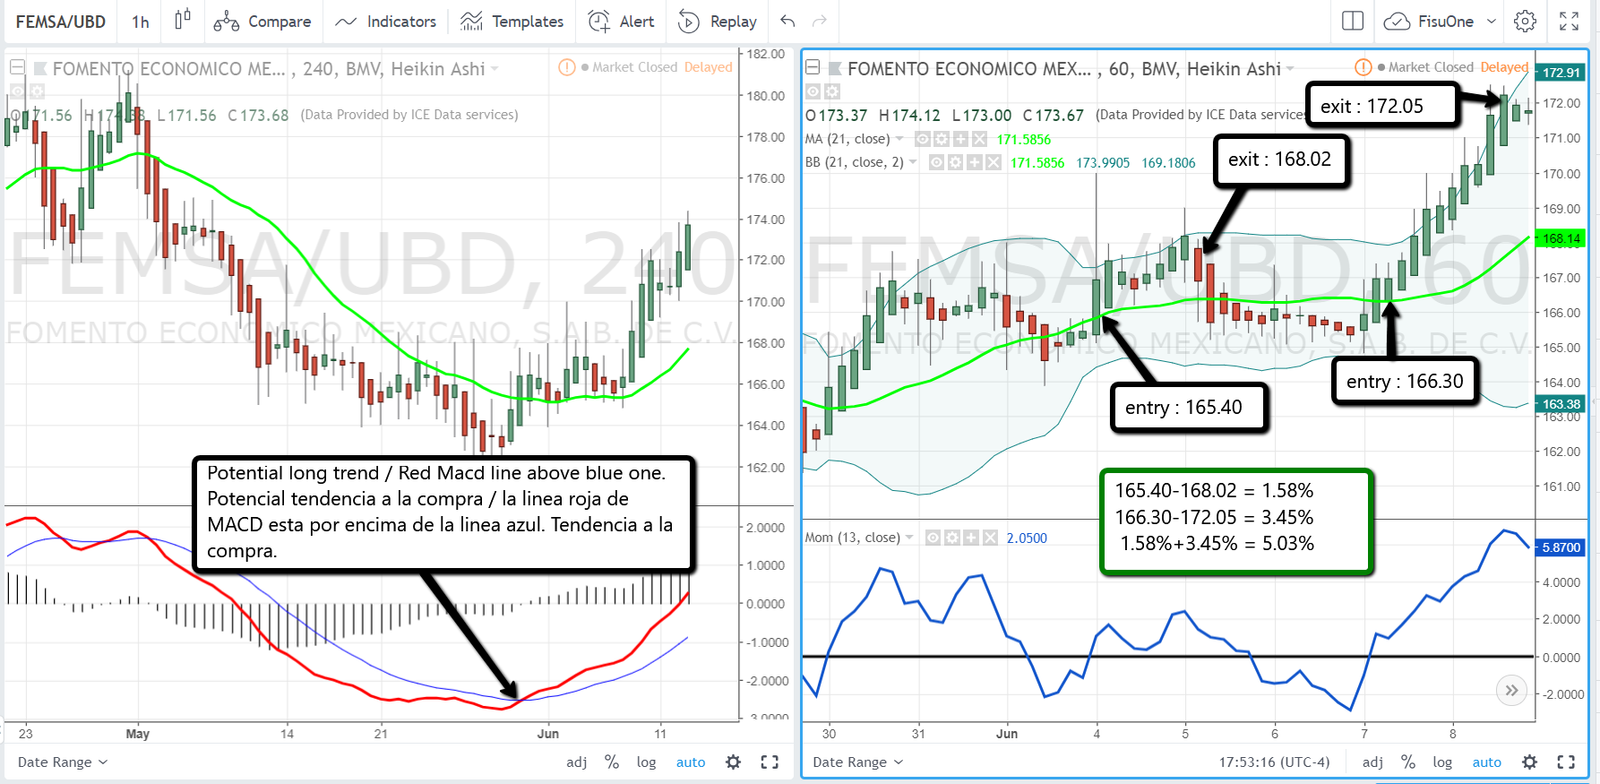
FEMSA gave a tendency to buy on the 4hr chart on the left and generated 2 very good purchase operations that totaled 5% in the week.
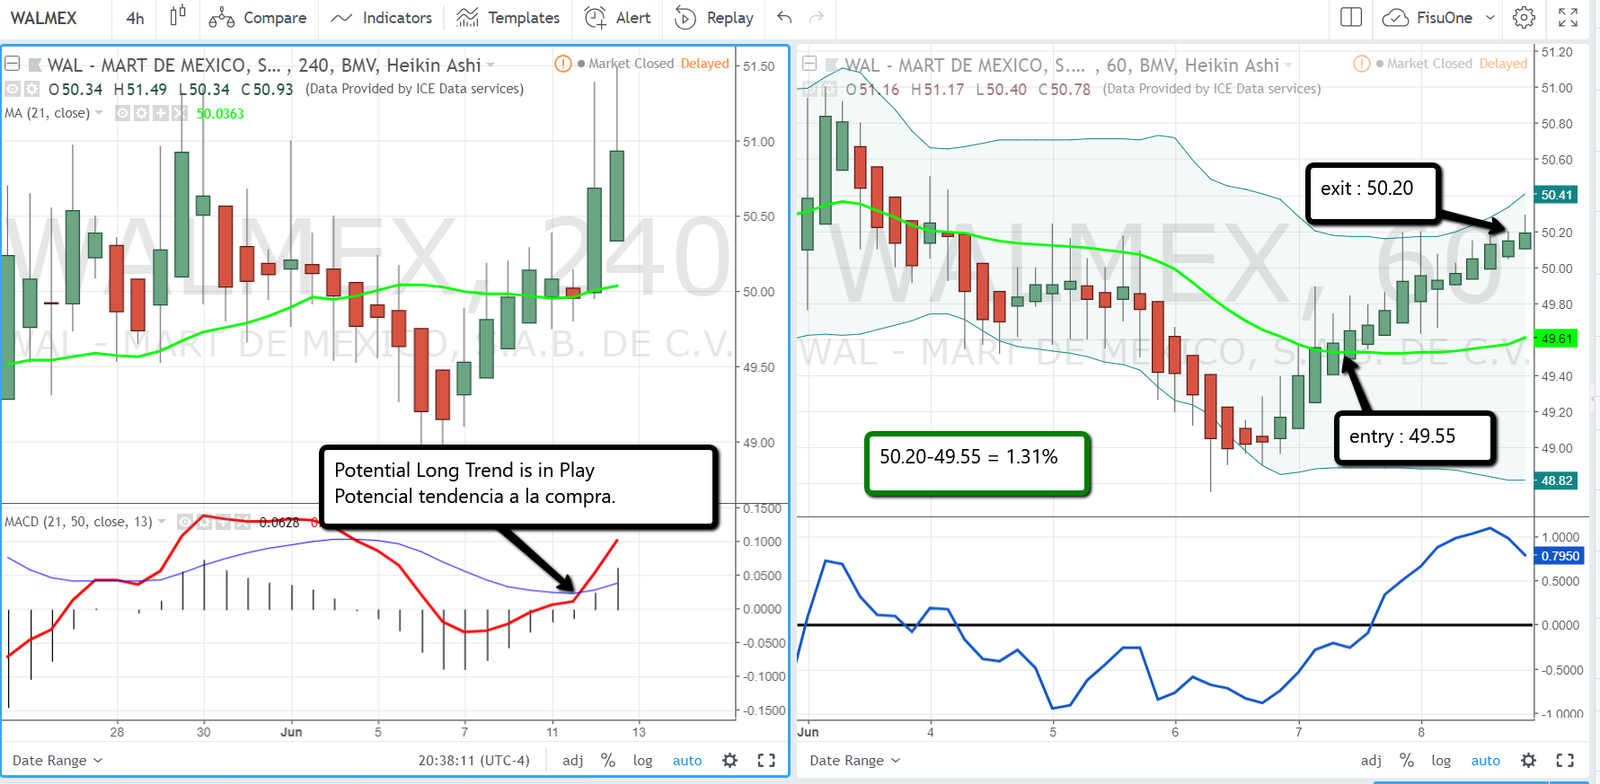
Walmex also gave a sign of potential purchase on the 4hr chart and when it went to look for buying operations in the week with the right chart of 1hr, there was a Walmex operation when it cuts the 21-period green line from bottom to top and at the same time the blue line of mometuum goes above zero indicating strength of the price. The exit as we always say is when the price starts to lateralize on the bolliguer bands or as in this case it is Friday and the operation of the week is closed. He gave 1.3% in the week.
Comments are closed here.