

Week 8 – 12 Oct 2018
October 13, 2018 3:00 pm| Market | Ticket | Long/Short |
| NYSE | TLRY | Long (Compra) |
| NYSE | SLV | Long (Compra) |
| NYSE | CLF | Short (Venta en Corto) |
| NYSE | XLE | Short (Venta en Corto) |
These are the trade that I will follow during the week. I comment as an opinion and should not be taken as financial advice. If you have any doubt, read the Terms and Conditions of the site.
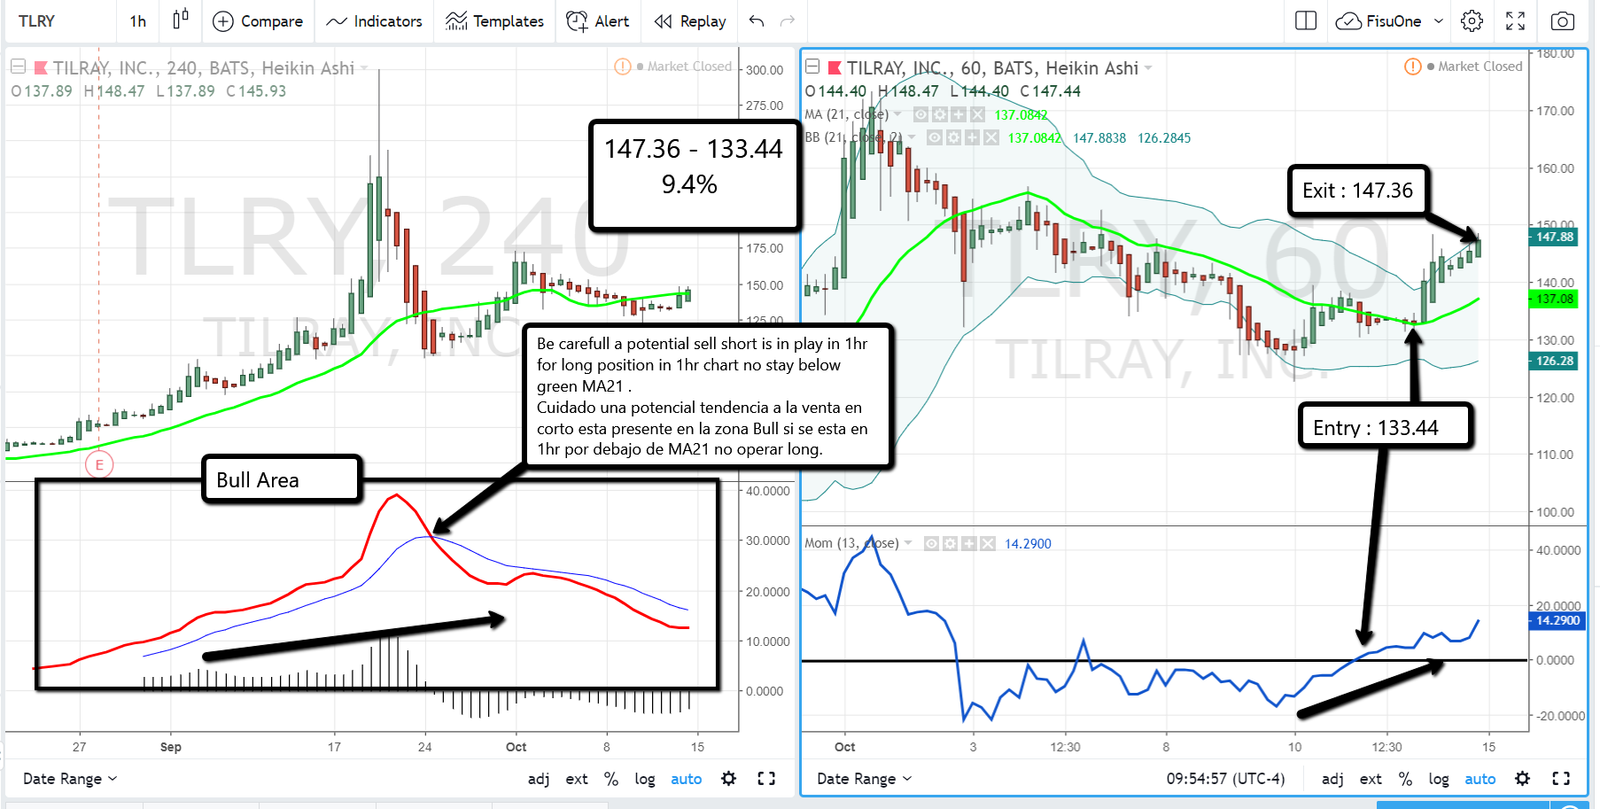
TLRY is in the 4hr chart on the left in Bull area, beyond which a potential short sale trend was formed, this does not preclude buying in 1hr when it is above the MA21 green line but does not trade as long if it is is below this green line in 1hr is the recommendation.
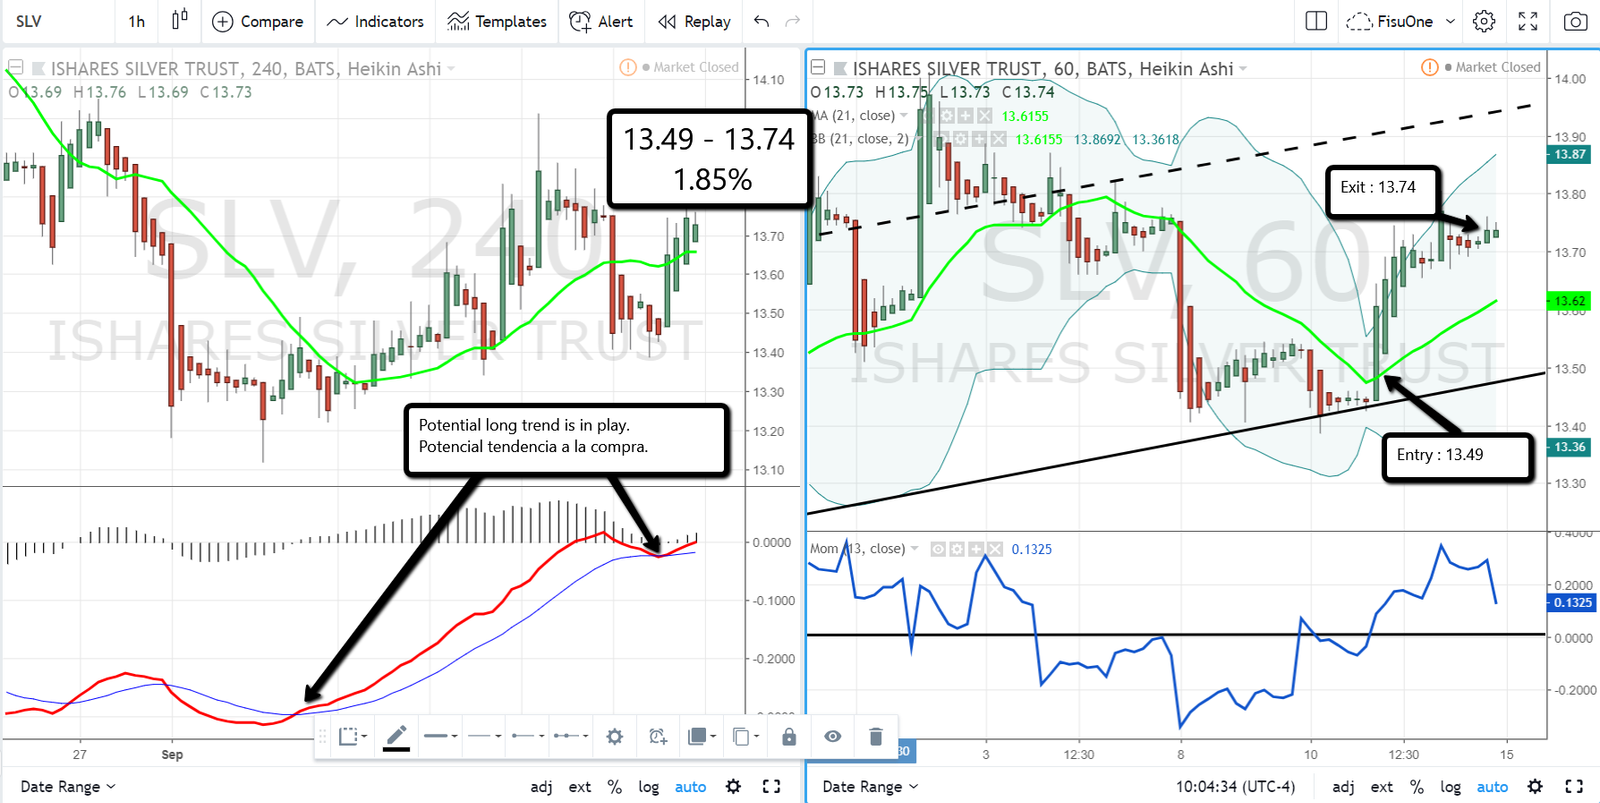
SLV potential trend to buy in 4hr chart on the left, so you have to look for buying opportunities in 1hr when the price is set above the MA21 green line and the blue line of momentum above zero and that is given in 13.49 and the output in 13.74 when it begins to lateralize and ends the week.
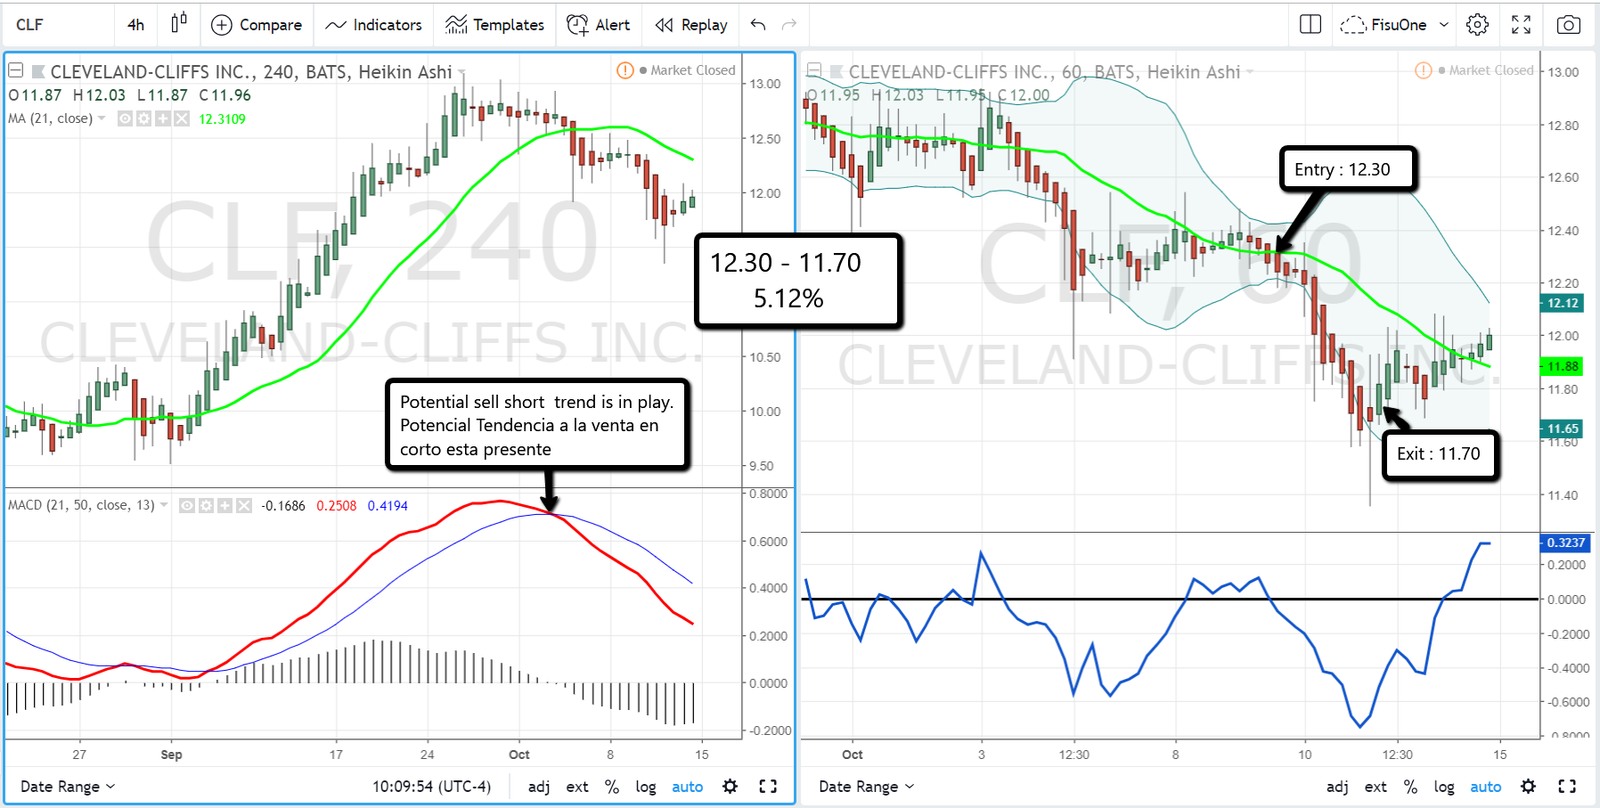
CLF set a potential sell short trend in 4hr chart on the left, so you have to look at the 1hr chart on the right for trades in this direction and this occurs at 12.30 when CLF cut down the green line MA21 and at the same time the momentum BLUE LINE goes below zero the exit as always is to be aware that the price loses strength in the direction of the trade and that occurs in 11.70 when lateralized and gives its first green candle care and exit signal, my recommendation is to leave when strength is lost.
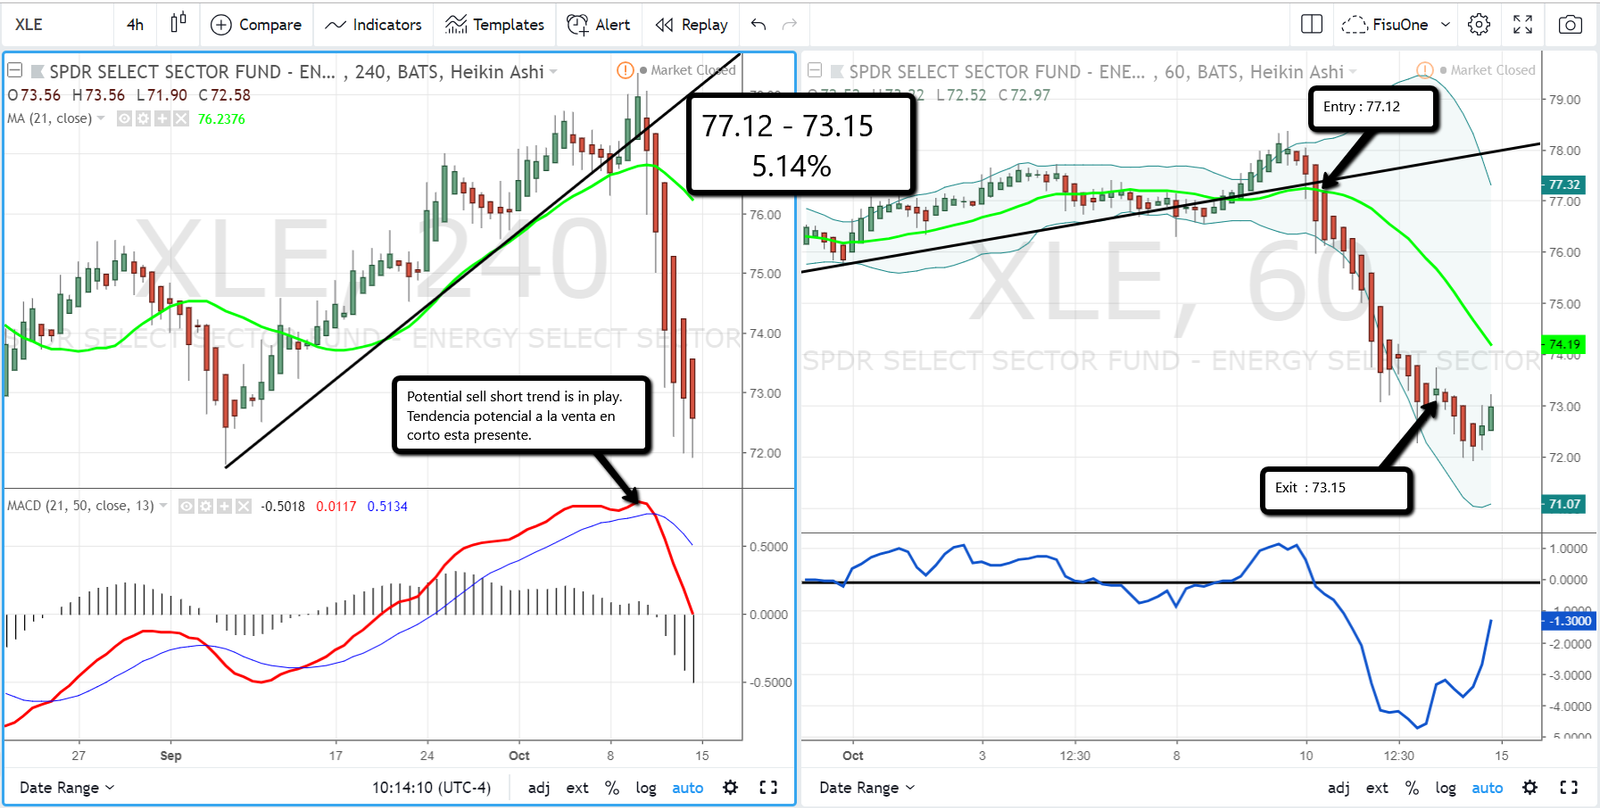
XLE gave in 4hr tendency to the potential sale in short reason why it is necessary to look for operations in this sense in the graph of the right of 1hr and this occurs when XLE cuts from top to bottom the green line MA21 and the momentum goes down that is given in 77.12 and the output on Friday when lateralize.
Comments are closed here.