
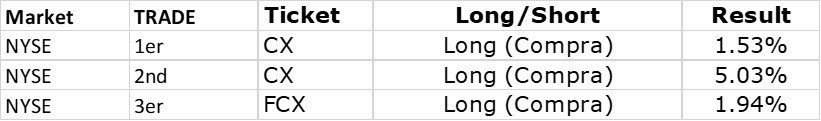
Week oct 12 – 16 2020 CEMEX goes back to the long side and FCX takes an interesting tour.
October 18, 2020 7:12 pmCEMEX goes back to the long side and takes an interesting tour.
These are the Trade that I will follow in the week. I comment on it as an opinion and should not be taken as financial advice. If you have any questions, read the Terms and Conditions of the Site.
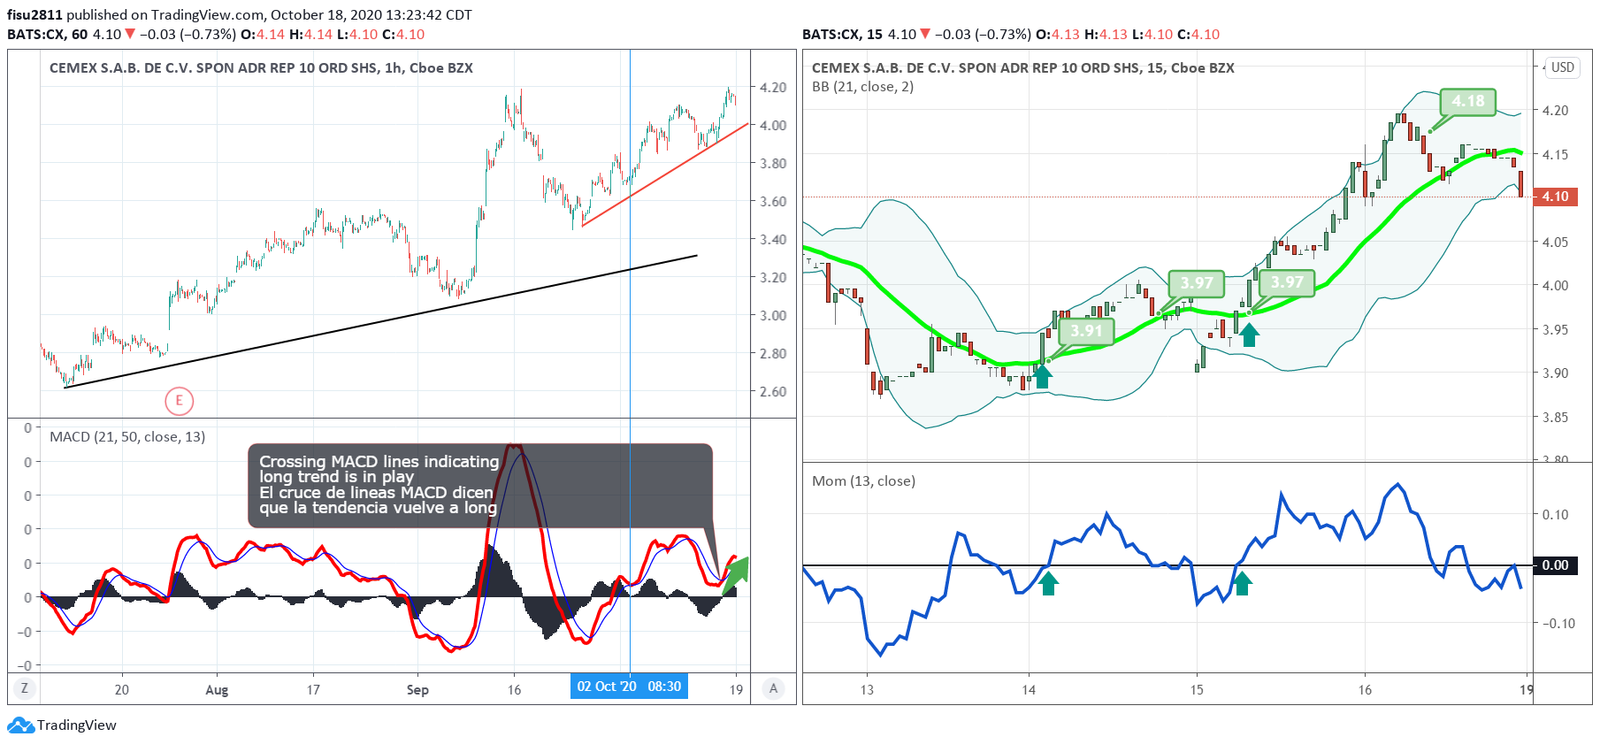
Cemex returns to the long trend in the hourly chart on the left and shows strength in the price in the chart on the right, which is a 15 min chart where it manages to cut the green line of 20 periods and the same time the blue momentum line of the lower indicator is above zero level and in no case in the week to fall below this level, which indicates strength in the price.
CX, on October 15, 2020, crosses its MACD lines to the buy or long side, this in the FisuOne® method occurs when the red MACD line is above the blue one, indicating the beginning of a bullish / long trend.
Defining the trend in the chart on the left, which is a hourly chart, I will look for at the chart on the right, which is 4/6 times less in time, as it is a 15 min chart where I look for entries and exits.
Then the FisuOne® method defines a long entry when the price of CX crosses the green MA21 line from the bottom up and at the same time the blue moment line crosses the zero line indicating strength in the price rise.
At that time I enter the TRADE at 3.91 and define at the time of entry where the stop level will be or leave the trade if the trade does not come out as I think and that level is what I call stop loss and always in the Method FisuOne® is placed at the minimum before the entry, which in this case is 3.88 This level is very important since it will define how many shares I am going to be able to buy depending on what I want to risk, in my case I always try that this value does not exceed 1% of my account, as a protection of my capital, which is the main thing in this business.
So if I have an account with 10,000 dollars and I want to risk 1% that means that I am only willing to lose 100 usd if the trade does not go as I think, in the chart above, CX has entry at 3.91 and if I define the stop loss at 3.88 means that 3.91 – 3.88 = 0.03 which means that the number of shares I can buy to risk 1% risk 100 / 0.03 = 3333 shares.
I can do this calculation the same with an account of 50,000 / 100,000 / 1,000,000, whatever I may have in my account and that will depend on each trader, what will change then is the amount of shares that can be bought but not the concept of risking 1 % for example with 100,000 what I am willing to risk will be 1000 usd that makes 1000 / 0.03 = 33333 what I would always do if I want to follow the FisuOne® method is to set a stop loss of 1% of my account to limit my losses very important question in trading.
Then the exit of the trade as always I can define it in 2 ways or I exit when the price begins to lateralize on the Bollinger Band line or I exit when the price cuts from top to bottom the green line MA21 this value 4.18.
Following this same methodology the next day I return to 3.97 and I leave at 4.18 giving 5.03%.
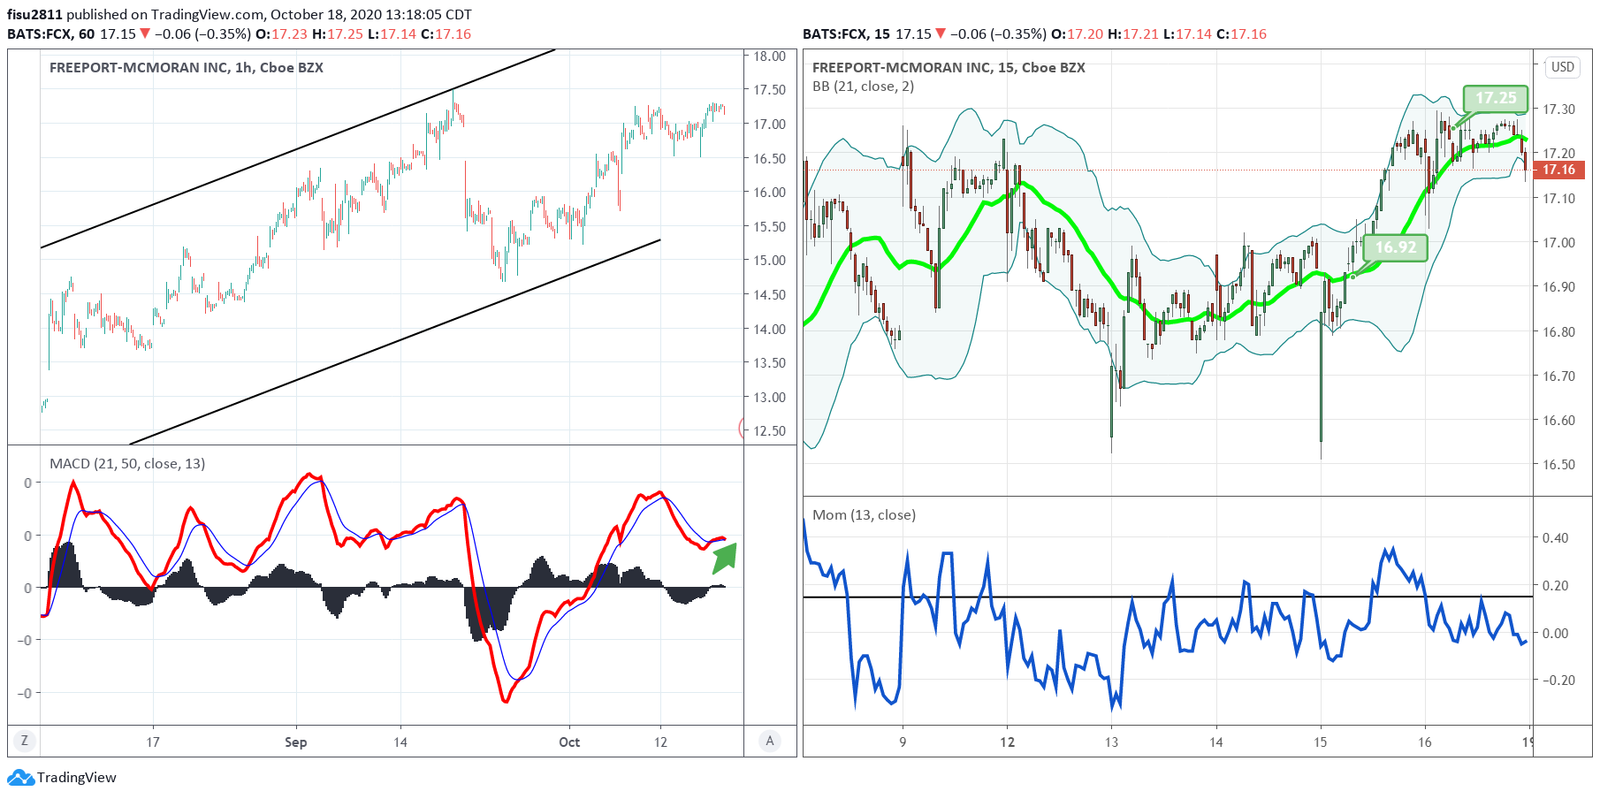
Same analysis situation in the week with FCX where I enter at 16.92 and leave at 17.25, giving this route 1.93% in the week.
These trades in a matter of 1 week provided a 8.5% rally.
The FisuOne® method on this website and in my book Trading for Relief® published on Amazon explains in detail how to establish and calculate this type of trade.
Comments are closed here.