
Weeks 4 Jun- 18 Jun 2019
June 23, 2019 9:59 pm
These are the Trade that I will follow in the week. I comment on it as an opinion and should not be taken as financial advice. If you have any questions, read the Terms and Conditions of the Site.
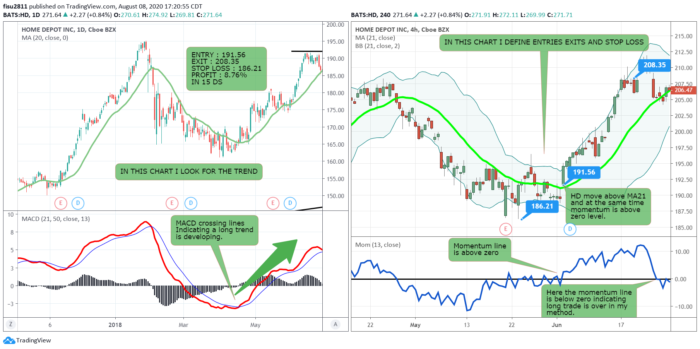
Home Depot gave a buying trend on the right chart which is a daily chart and then on the left which is a 4 hour chart we looked for the entries and exits points for the long trend that we follows from the right chart.
The entry in the FisuOne® Method occurs when the price of the financial asset that I am buying in this case HD cuts from below to above the MA21 and at the same time the Momentum line cuts up the level of 0 indicating strength in the price rise.
From June 4, which is when the price is above MA21 at the level of 191.56 until june 18 where it begins to lateralize in the Bollinguer bands at the level of 208.35 where a possible exit is signaled.
The stop loss as indicated in the FisuOne® Method is very important and you can see it as the minimum price before the entry, In my case when I enter I only risk 1% and that defines the number of shares that I will buy in this operation if I decide to do it, I also explain that in my webinars, in the FisuOne® Method and in the next talks I have with you, it is always a very important point.
Because Risk control and discipline are 2 actions that make this work rewarding, without it, you can lose a lot of money.
Comments are closed here.