
Weeks 5 June- 2 July 2019
July 7, 2019 1:11 am
These are the Trade that I will follow in the week. I comment on it as an opinion and should not be taken as financial advice. If you have any questions, read the Terms and Conditions of the Site.
Freeport McMoRan is a stock listed on the NYSE is a mining company that primarily explores copper, gold, silver and other metals.
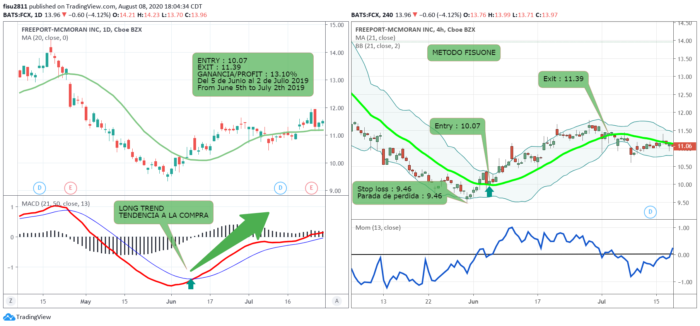
In the graph on the left, which is a daily chart, this means that each bar is one day I look for the trend of the financial instrument that I am doing in this case FCX.
As the FisuOne® method indicates, when the MACD line crossing occurs in the sense that the red line is above the blue one, a period of buying trend begins. Therefore, determining that the trend of FCX is to buy,
I look for an entry for buying on the right chart and again consulting the FisuOne® Method, this entry occurs when the price is above the green line MA21 and at the same time the Momentum line is above the zero line, here I enter the trade
The exit of the operation in this case is given when FCX cuts the green line MA21 in the opposite direction that is to say from top to bottom and at that moment I exit the operation.
As always, I set the stop on the minimum before entry and the distance between this previous minimum and the entry will define the amount of shares to buy depending on the risk that I want to assume and that depends on each person.
In the FisuOne® method and in my book Trading for relief it is explained how to calculate this number in my case I use a 1% risk, it may seem a lot or a little to some people but that depends on each person and is not the end determine which one is appropriate since it is about teaching a method and not providing financial advice on the matter.
Comments are closed here.