

Weeks april 22 – june 05 2019
June 5, 2019 1:43 am
These are the trade that I will follow during the week. I comment as an opinion and should not be taken as financial advice. If you have any doubt, read the Terms and Conditions of the site.
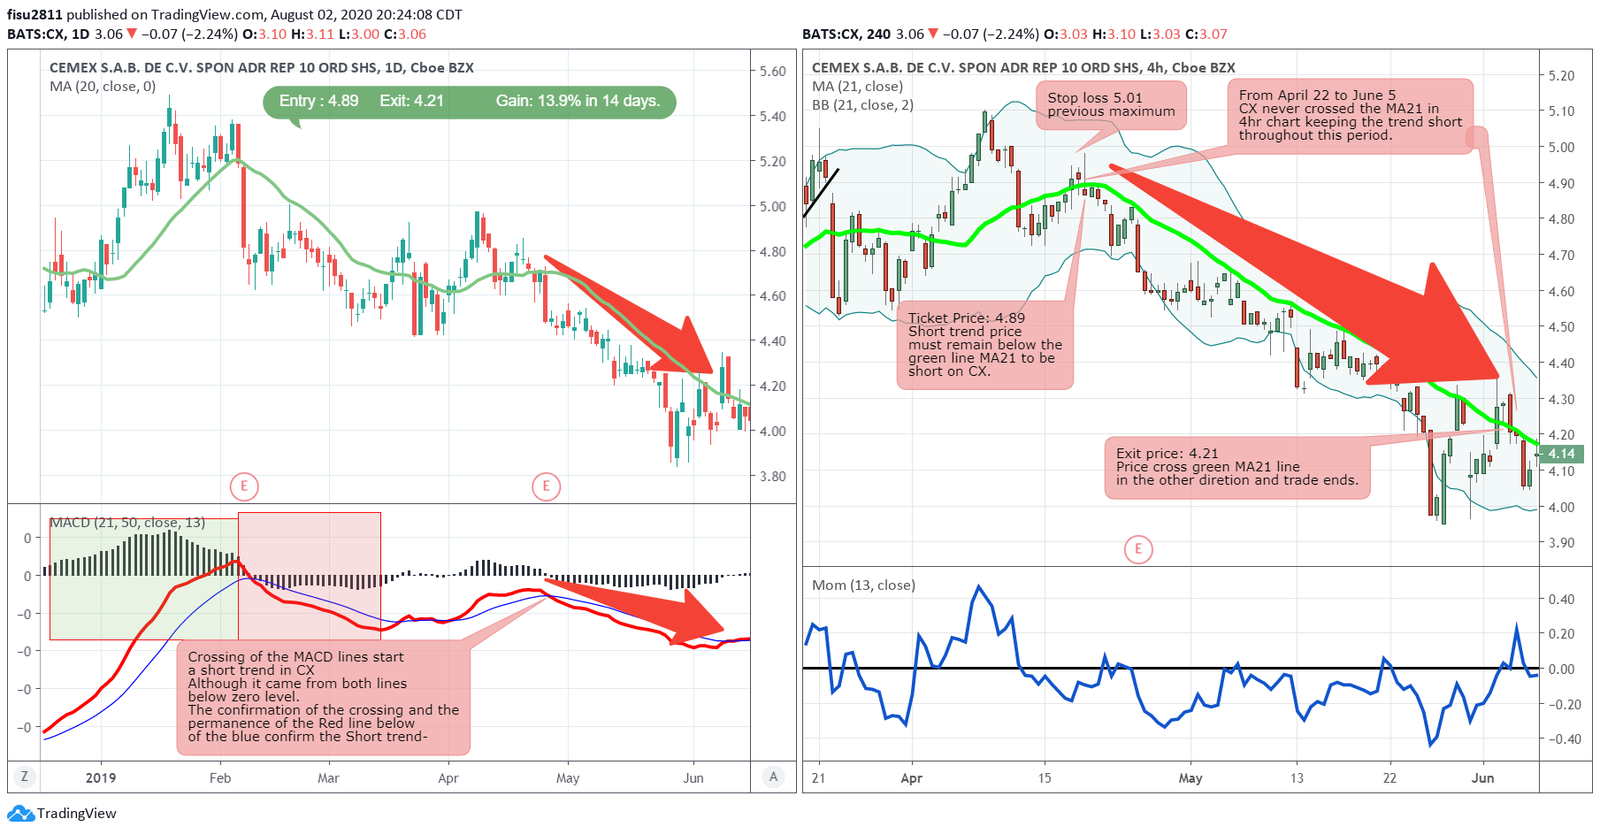
Cemex had previously shown weakness price and this continued to be shown in the daily chart on the left where in the FisuOne® method when the red signal MACD line crosses below the blue MACD line confirms a short trend.
In this case you have to go to the 4hr chart on the right to find the entry point and it appears when the price crosses below the green line MA21 and stays below it, throughout the route that the price continues through.
Below this green line the short selling position is sustained.
Comments are closed here.