
Weeks May 29 – Jul 15 2020
July 16, 2020 2:27 am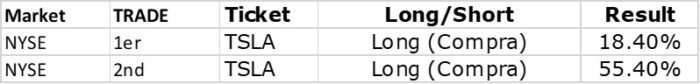
These are the Trade that I will follow in the week. I comment on it as an opinion and should not be taken as financial advice. If you have any questions, read the Terms and Conditions of the Site.
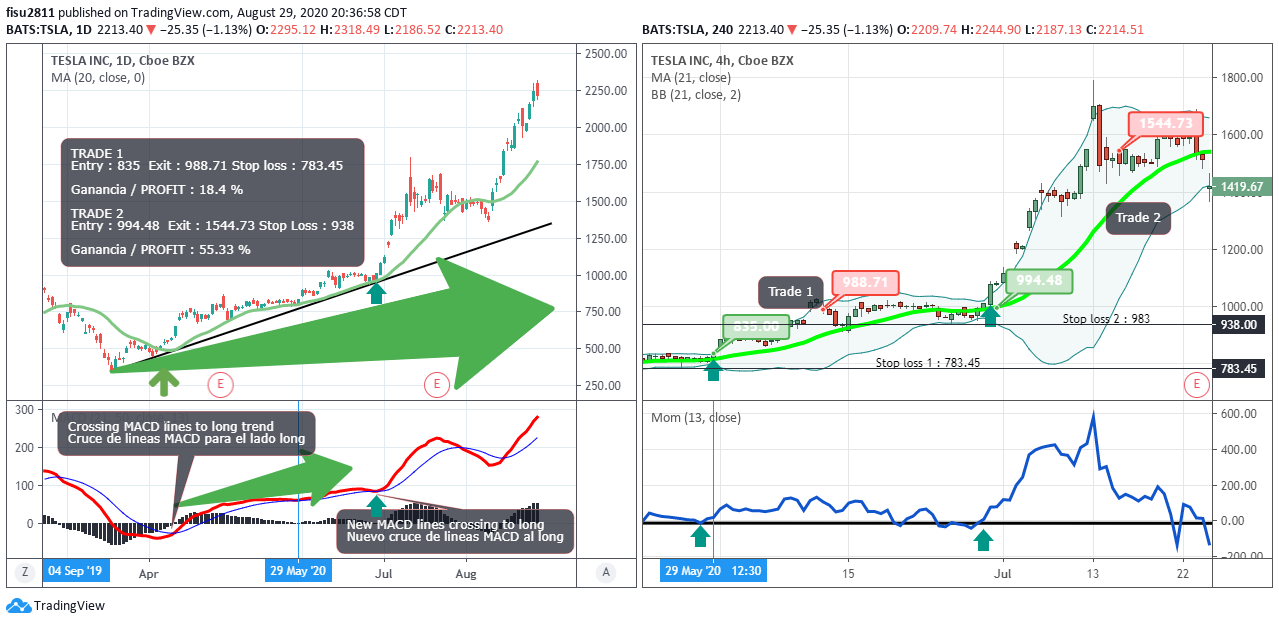
TESLA on May 29, 2020 makes crossing MACD lines to the buy or long side, in the FisuOne® method, this occurs when the red MACD line is above the blue one, indicating the beginning of a long trend.
Starting from defining the trend in the graph on the left, which is a daily graph, I will look at the graph on the right, which is 4/6 times less in time, such as a 4-hour graph shown in the example, inputs and outputs for a buy trade.
Then the FisuOne® method defines a long entry when the price of TSLA crosses the green MA21 line from below to above and at the same time the momentum line crosses the zero line indicating strength in the price rise, this occurs from May 29 .
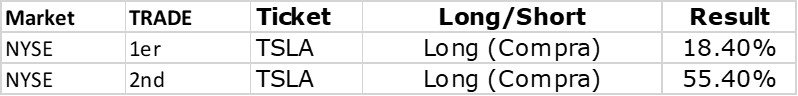
At that moment I enter the first TRADE at 835 and define at the time of entry what will be the level of stopping or leaving the trade if the trade does not come out as I think and that level is what I call stop loos and always in the FisuOne® method is placed at the minimum before the entry, which in this case is 783.45. This level is very important since it will define how you know the amount of shares that I will be able to buy depending on what whoever wants to make this trade wants to risk, in my case I always try that this value does not exceed 1% of my account, as protection of my capital which is the main thing in this business.
So if I have an account with 10,000 dollars and I want to risk 1% that means that I am only willing to lose 100 usd if the trade does not go out as I think, that going to the example, Tesla has entry in 835 and if I define the stop loss In 783.45 it means that 835-783.45 = 51.55 which I can buy 100 (1% what I want to risk) / 51.55 = 1.92 shares, so I will buy 2 shares of Tesla and risk a little more than 100 would be in this case 103.1.
This calculation I can do the same with an account of 50,000 / 100,000 / 1,000,000 whatever I may have in my account and that will depend on each trader, what will change then is the amount of shares that can be bought but not the concept of risking 1 % for example with 100,000 what I am willing to risk will be 1000 usd that makes 1000 / 51.55 = 19.39 which will be the same to say 20 shares and I risk a little more, that is 1031 instead of the 1000 that make 1% of the account but it is understood that what I would always do if I follow the FisuOne® method is to set a stop loss of 1% of my account to limit my losses, a very important question in trading.
Then the exit of the trade as always I can define it in 2 ways or I exit when the price begins to lateralize on the Bollinger Band line or I exit when the price cuts from top to bottom the green line MA21 this value in trade 1 is 988.71 .
In the case of trade 2 I repeat the same FisuOne® method explained just in trade 1 to follow this price movement.
In the FisuOne® method and in my book Trading for Relief® (Amazon) it is explained how to calculate and to understand this type of trade.
Comments are closed here.