

Week 16 – 20 July 2018
July 22, 2018 1:25 am| Market | Ticket | Long/Short |
| NYSE | MU | Long (Compra) |
| ETF | IBB | Short (Venta en Corto) |
| ETF | FXI | Long (Compra) |
| BMV | TELEVISA | Short (Venta en Corto) |
| BMV | ALFA | Short (Venta en Corto) |
These are the trade that I will follow during the week. I comment as an opinion and should not be taken as financial advice. If you have any doubt, read the Terms and Conditions of the site.
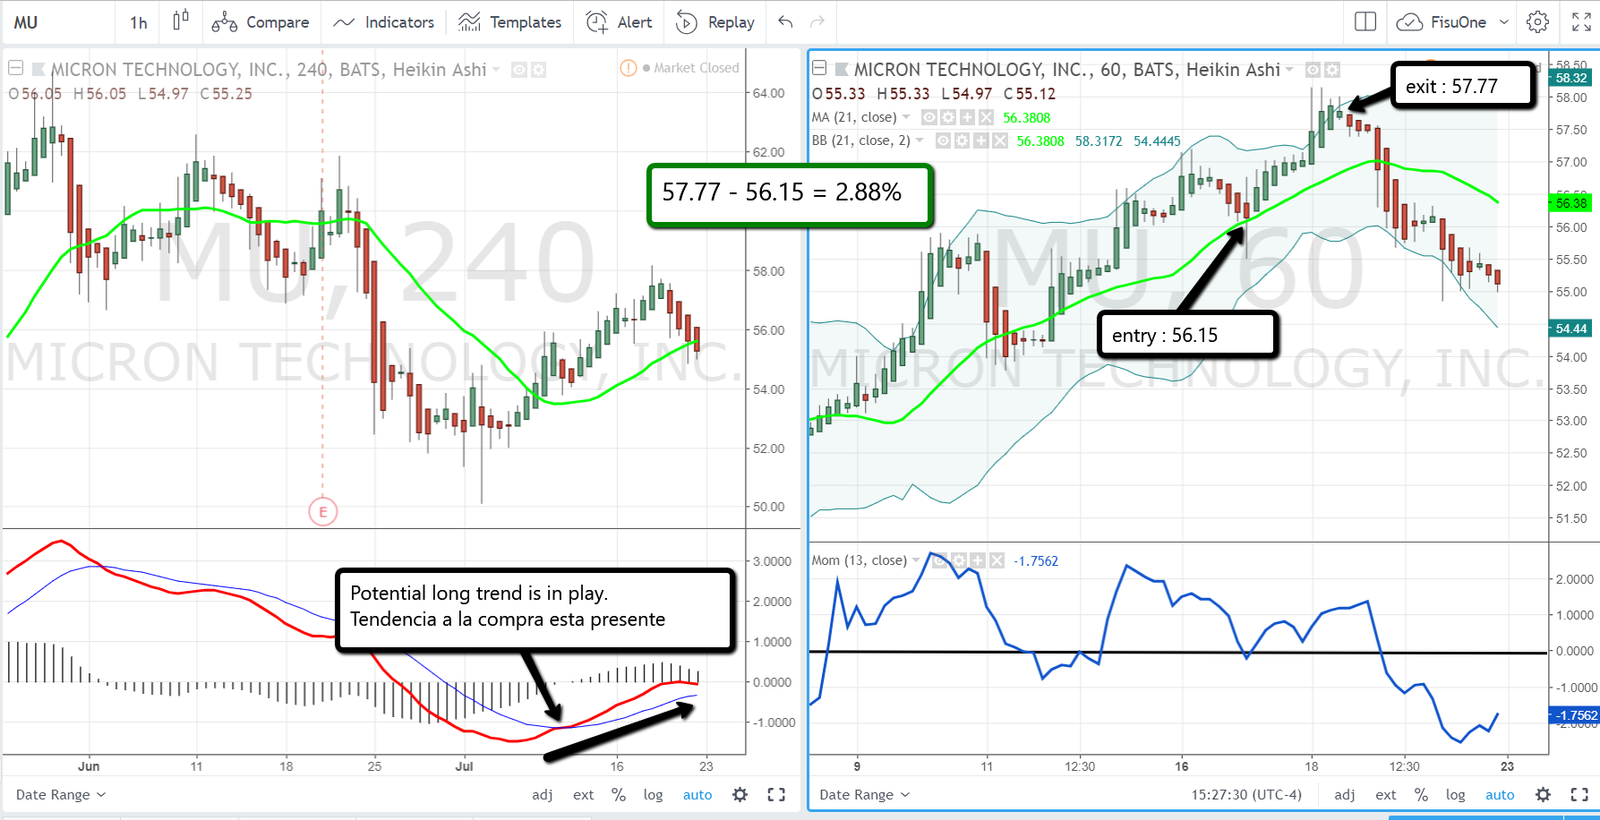
MU gave a signal of potential tendency to buy at the beginning of the week, so the only thing that was necessary to do is to wait for the moment to enter the buy trade, following the FisuOne® method, that occurred mid-week when MU touch the green line MA21 since the previous week had crossed the same to the buy side so in these cases the only thing that can be done to be long is to wait for the price to approach the MA21 but should not cross it in the other direction or the long trade is finished, after entering the trade the question is when to exit it, then it is decided to leave when after spending 2% of growth the price starts to lateralize for which, in order not to lose what is won, it is decided to go out in the first red candle. Entry at 56.15 and exit at 57.77 with a 2.88% difference.
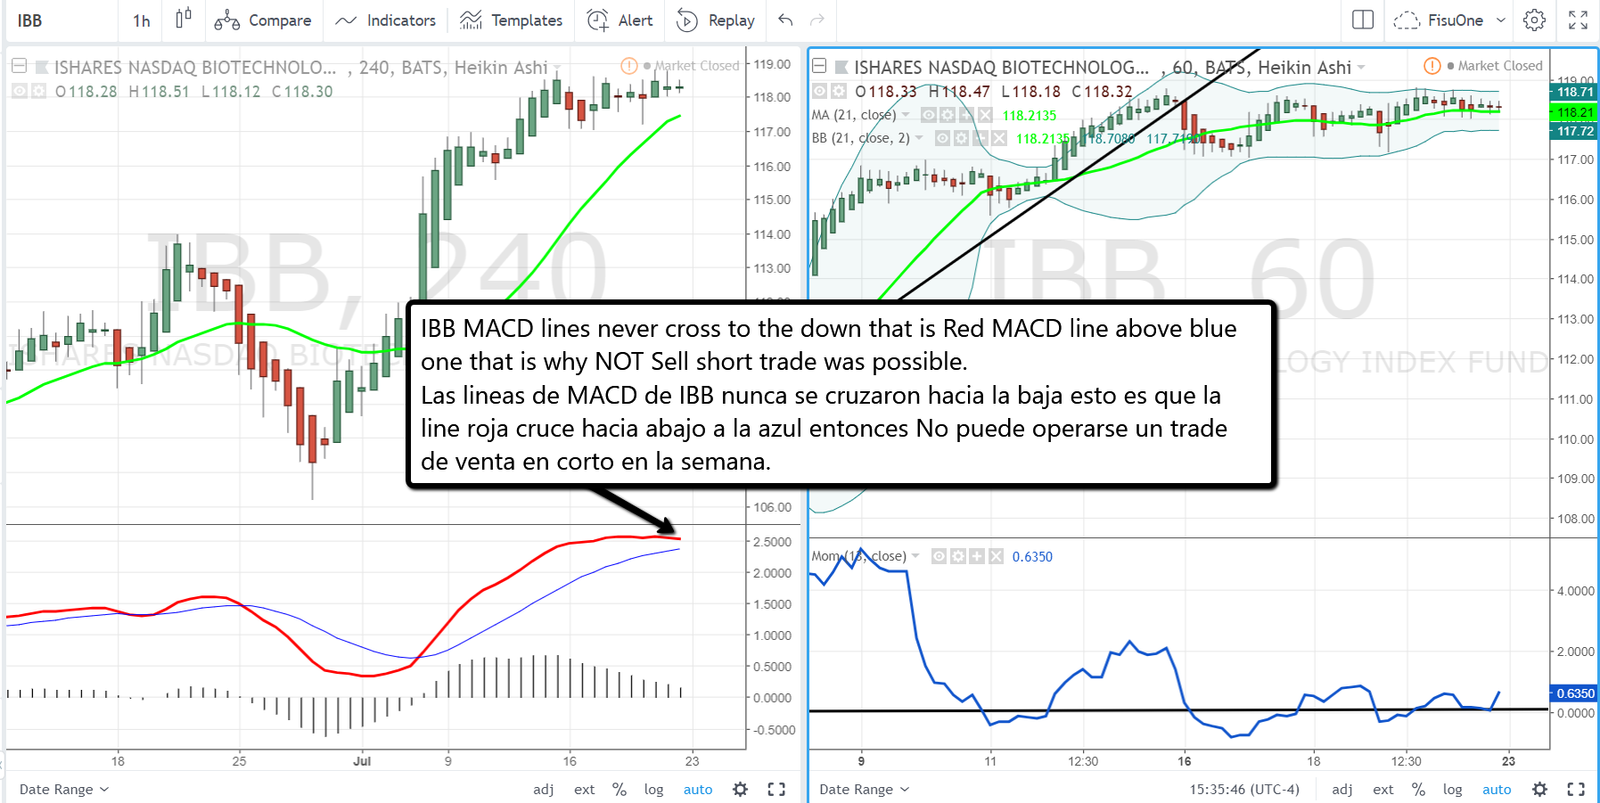
IBB in the chart on the left never gave a sign of a sell short trend, so it was never possible to make a sell short operation in the chart on the right.
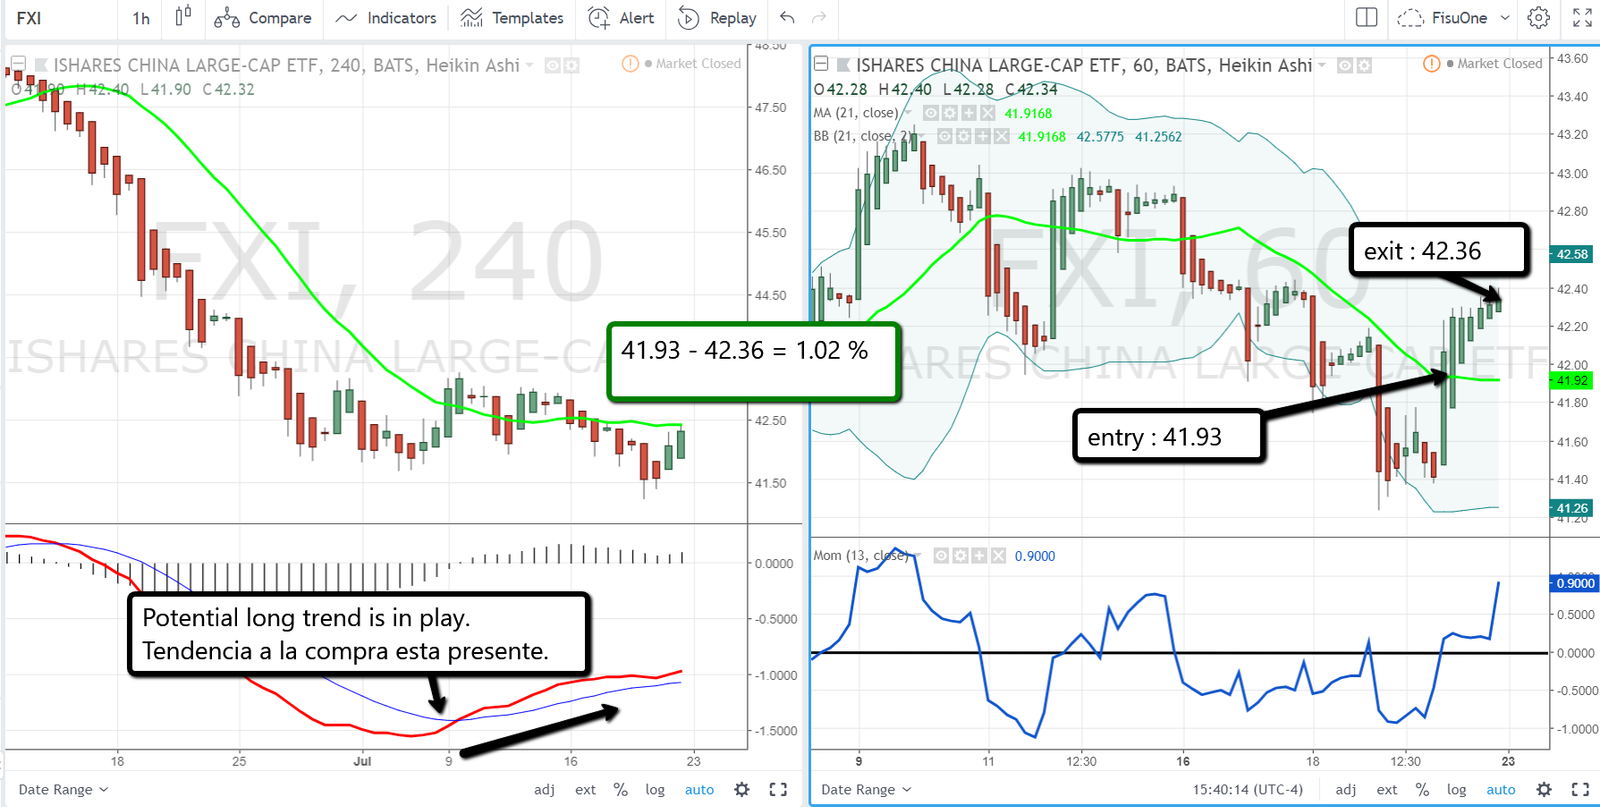
FXI gave a tendency to buy on the left chart of 4hrs, so I have to look for a purchase transaction and it happened at the end of the week when FXI crossed the MA21 green line from bottom to top and the momentum crossed towards up the zero line this price path was 1.02% in the week.
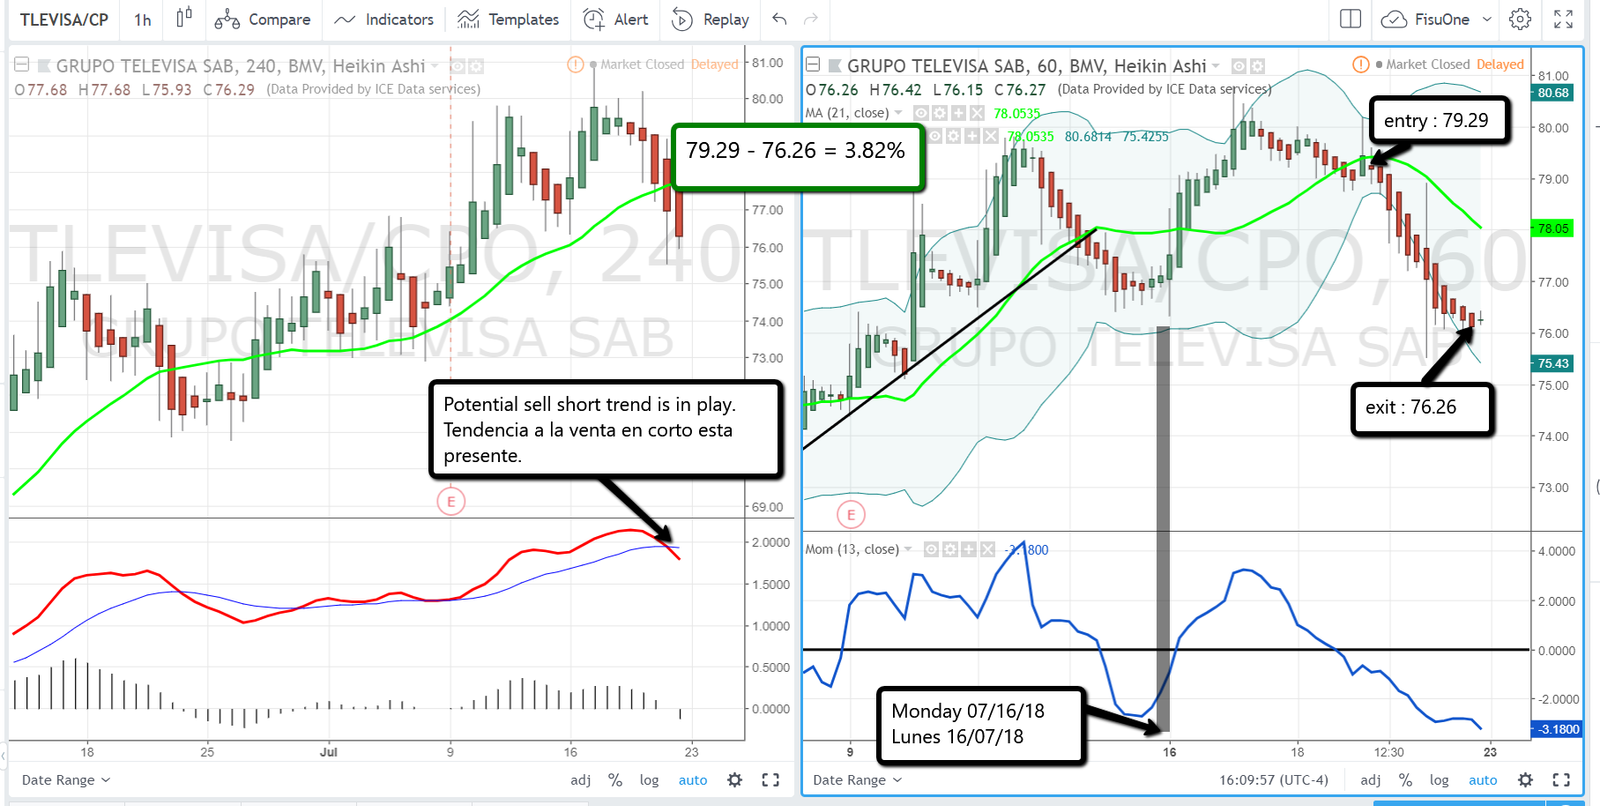
About the end of the week Televisa gave a sell short signal, in the graph on the left where you can see the same when the MACD lines are cut down, that is the red line of MACD crosses the blue down, after that, the chart on the right looks for the moment when the price crosses the green line of 21 mobile periods from top to bottom and shows if the momentum behaves in the same direction. The entrance was at 79.29 and the exit at the end of Friday to close the week was at 76.26 with a 3.82% run.
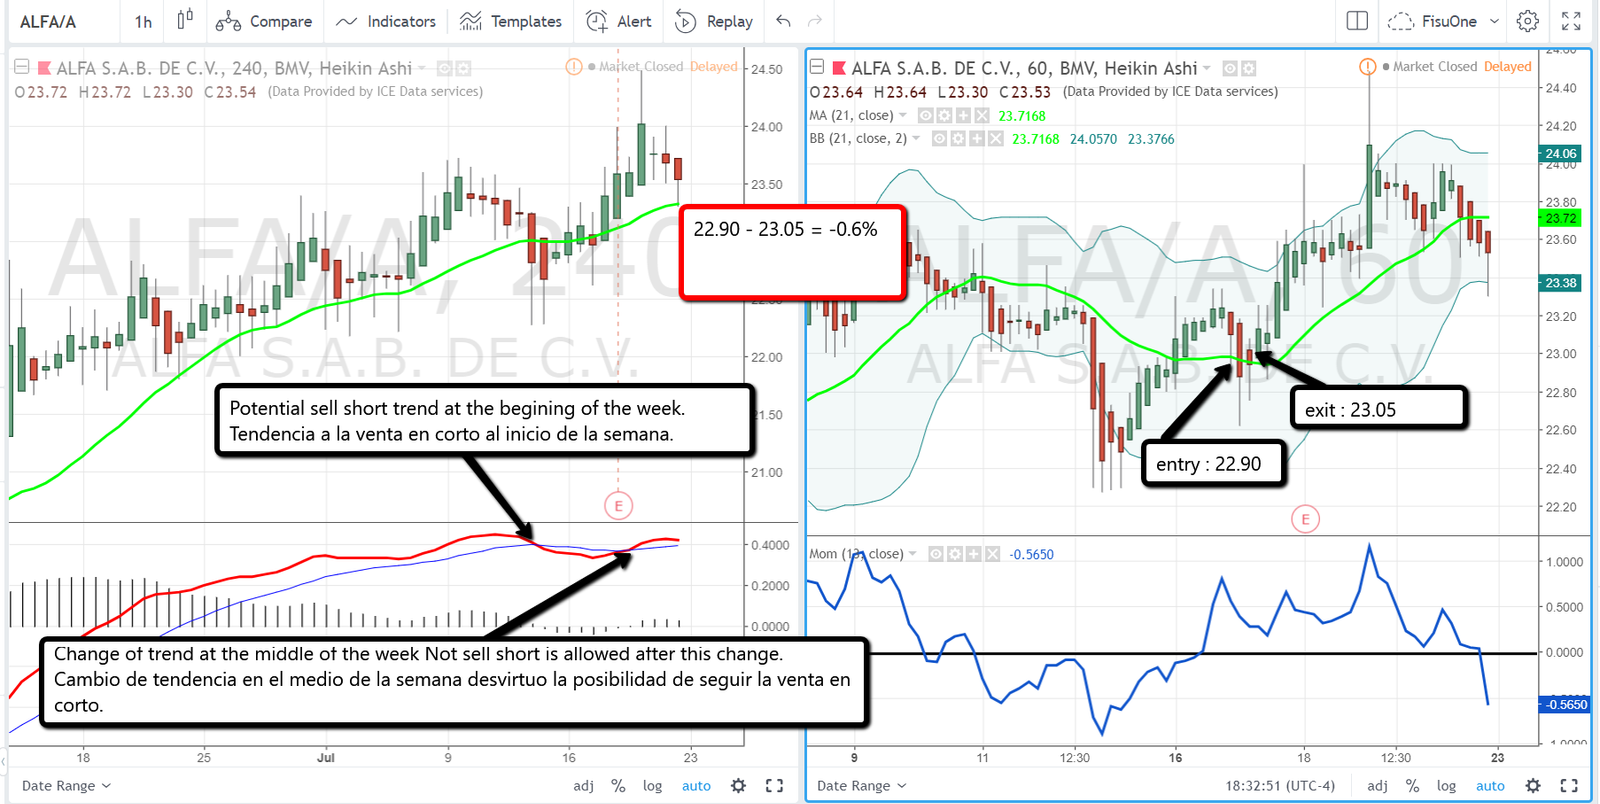
ALFA gave a sell short signal in the left 4hrs chart and therefore an entry was sought for sell in the chart on the right but this entry in 22.90 was quickly cancelled because the next candle was in the opposite direction and therefore nullifies the possibility of remaining short on ALFA and left at 23.05 with a loss of -0.6% if it is observed in the rest of the week the short selling trend is also cancelled on the 4hr chart since within the LONG territory, as explained in the method FisuOne®, a signal of potential tendency to buy that occurs when the MACD Red line cuts from bottom to top to the blue line and thus cancels any possibility of going short in this week.
Comments are closed here.