

Week 6 – 10 August 2018
August 6, 2018 2:03 pm| Market | Ticket | Long/Short |
| NYSE | CLF | Short (Venta en Corto) |
| ETF | XLF | Short (Venta en Corto) |
| CRYPTO | BTCUSD | Long (Compra) |
| BMV | GMEXICO | Short (Venta en Corto) |
These are the trade that I will follow during the week. I comment as an opinion and should not be taken as financial advice. If you have any doubt, read the Terms and Conditions of the site.
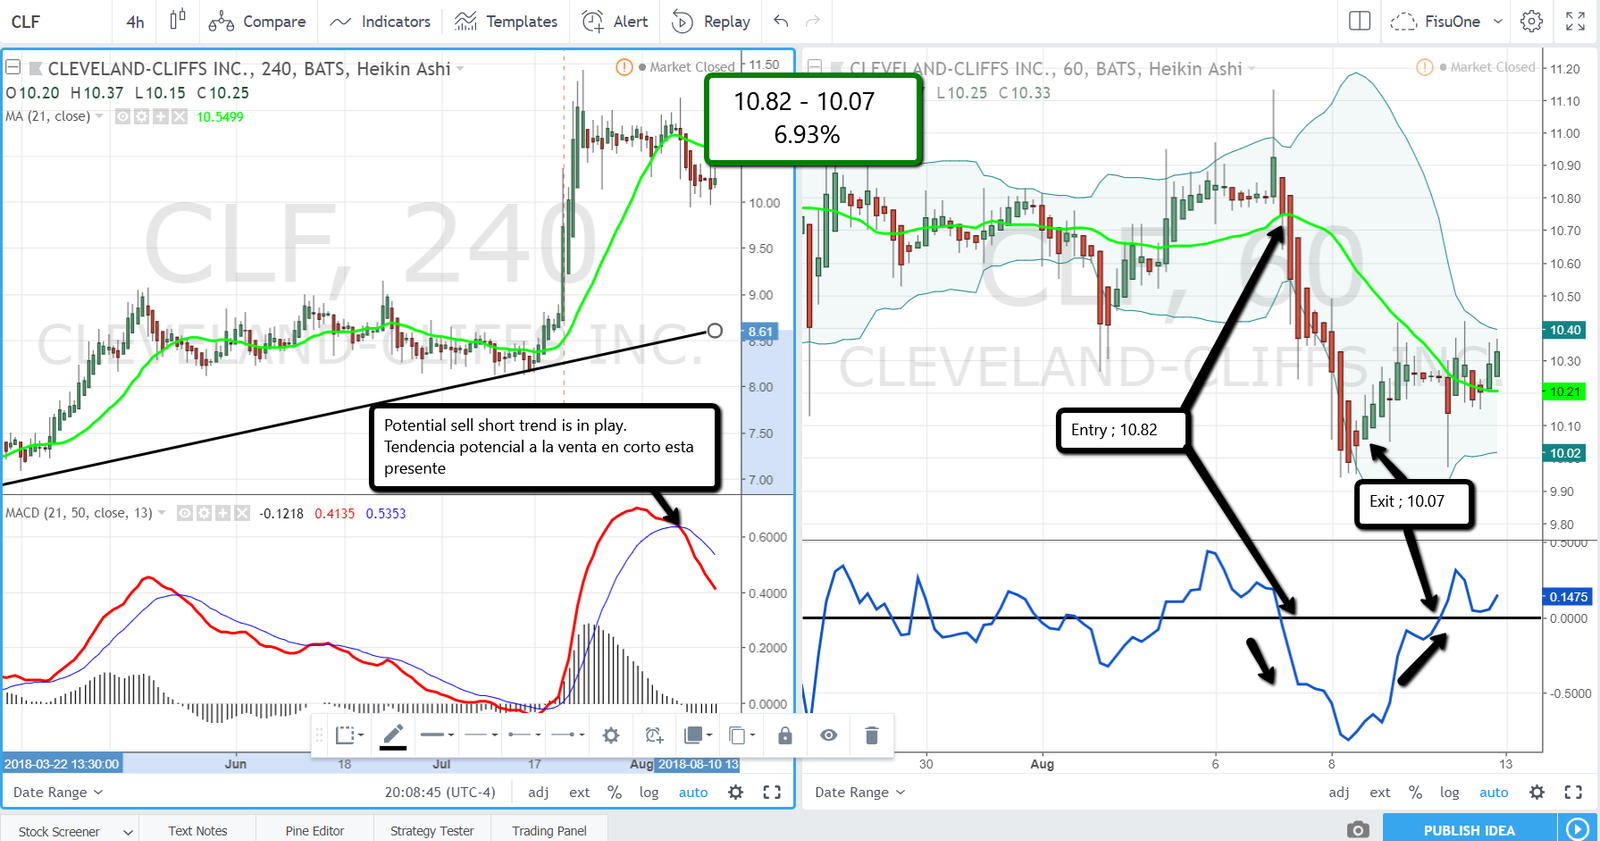
CLF offered in the 4hr chart on the left a potential sell short trend, this can be seen with the crossing of MACD lines and as we know about the FisuOne® method, it is a short selling trend when the MACD red line is below the blue one.
Once the trend is identified, the graph on the right of 1hr is searched for points of entry and exit. The entry occurs when the price crossed the green line of 21 mobile periods down and the blue momentum line, cuts the zero line from top to bottom.
The exit occurs when the price starts to lateralize and the momentum line cuts in the opposite direction to the zero line or otherwise the price cuts the green line MA21.
If lateralization is identified and a lot more than 2% has already been achieved The best thing to do is leave.
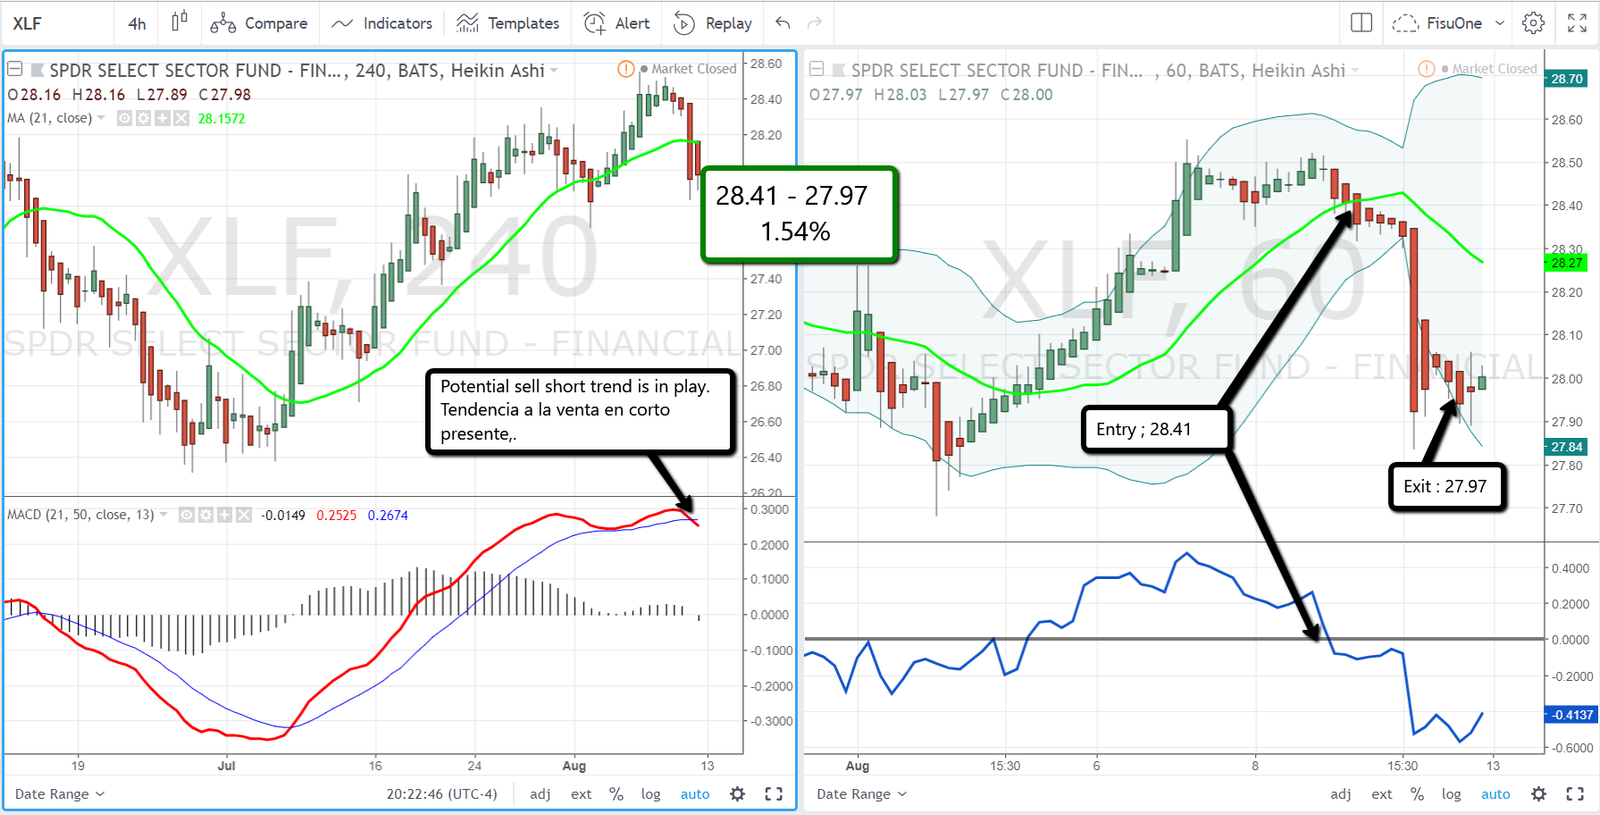
With XLF the same thing happened as with CLF, the trend was identified in 4 hr and it was operated in the direction of the sell short trade in the 1hr chat on the right and 1.54% was achieved.
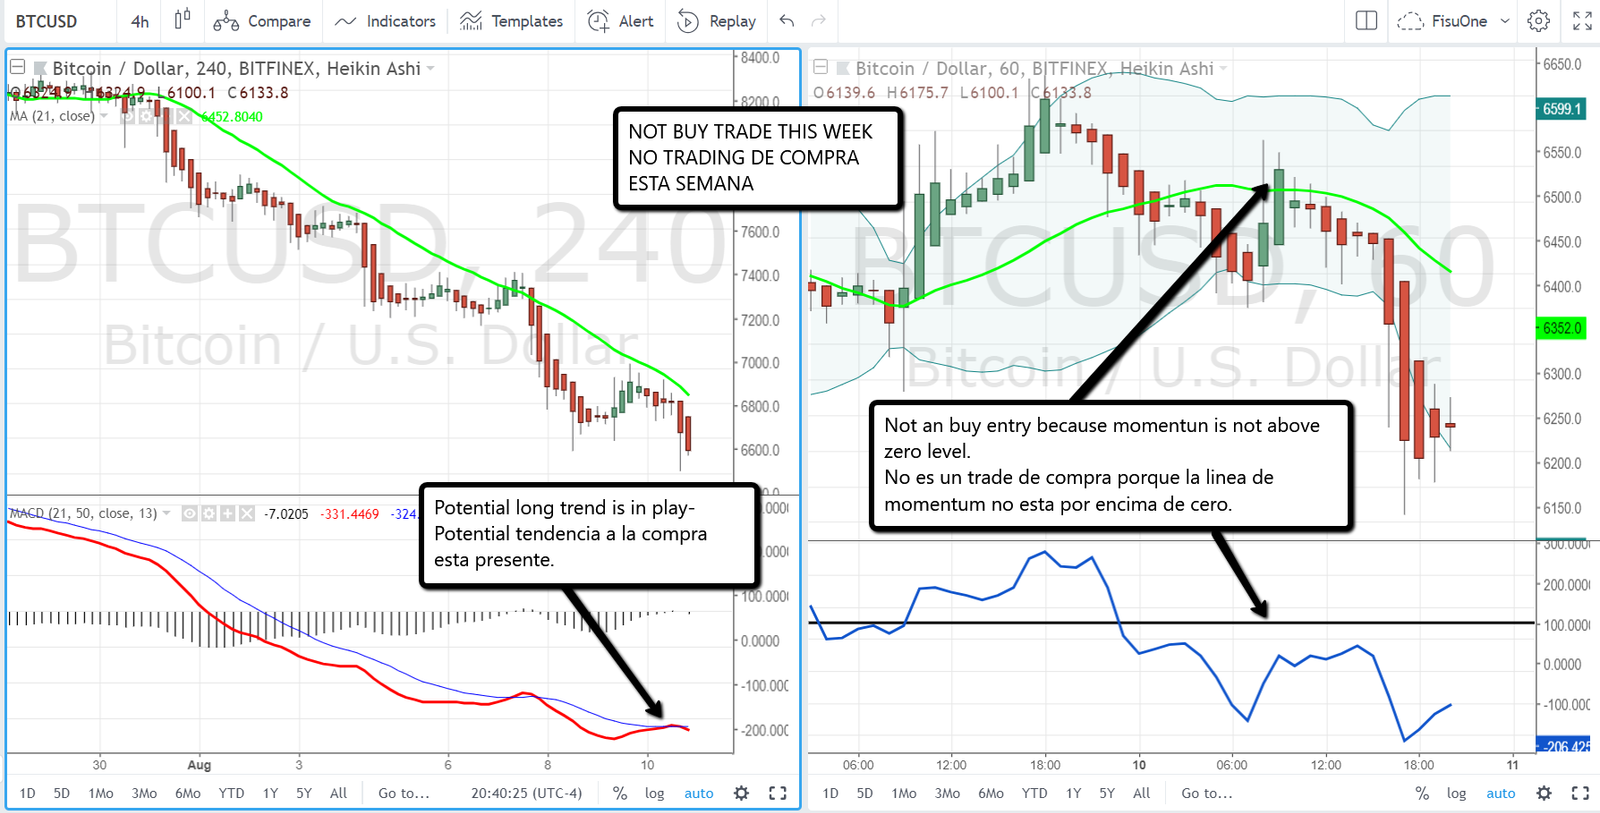
In the case of BTCUSD, we can observe a potential buy trend that could not be fully manifested in the left 4hr chart since the crossing of the MACD lines was not fully marked. When the buy trade was searched in 1hr, it never gave a complete signal of entry, because the momentum never crossed the zero line.
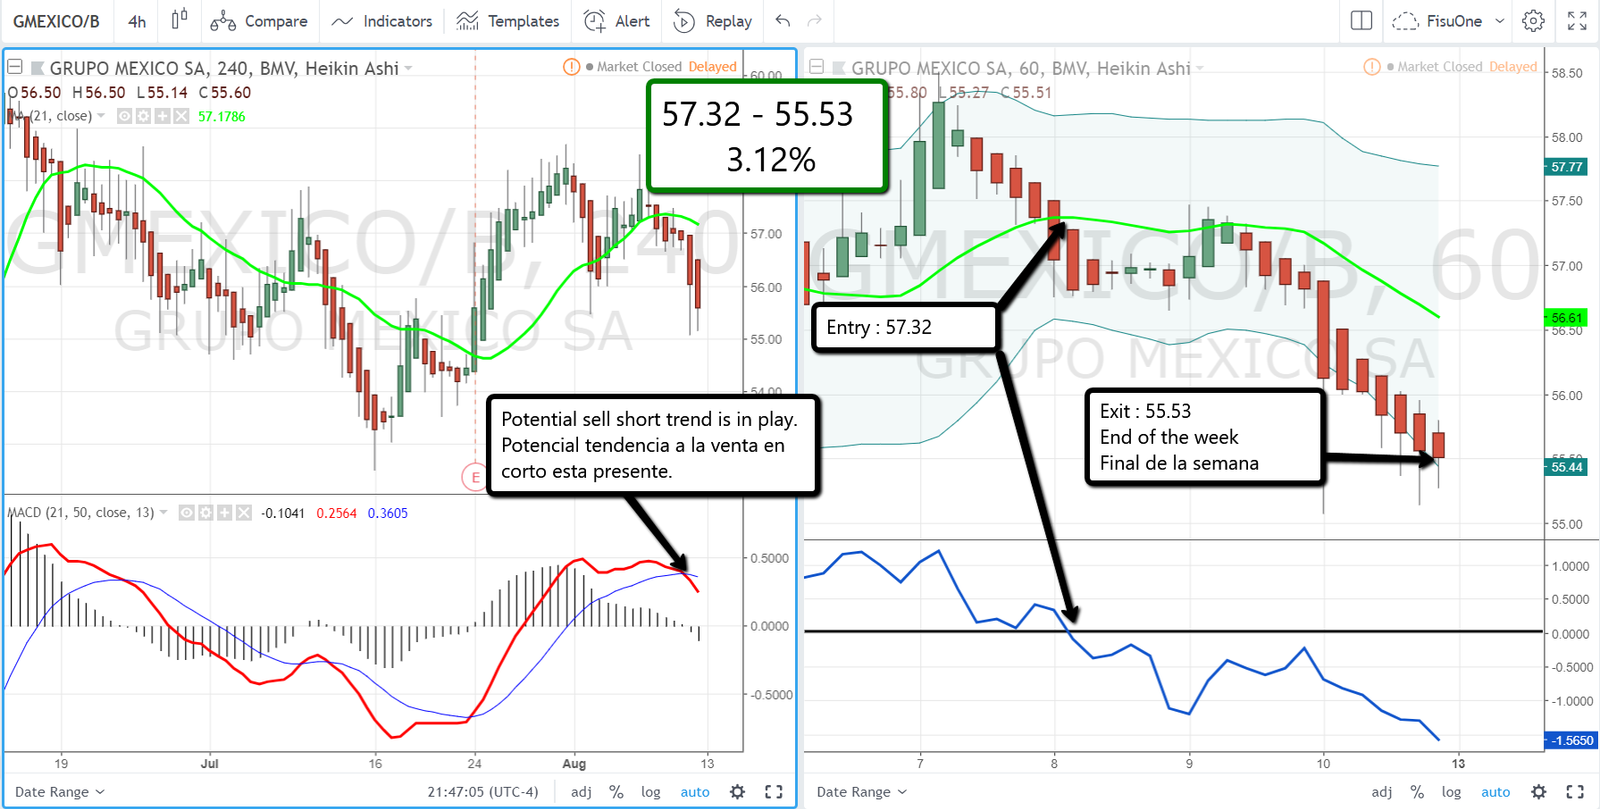
With GMEXICO there was a potential short selling trend in 4hr chart on the left, so a short sale trade was sought in the 1hr chart on the right as seen in the above chart, then applying the FisuOne® method already explained we have the entry and exit point and 3,12% of earning.
Comments are closed here.