

Week 28-1 June 2018
June 1, 2018 12:41 am| Market | Ticket | Long/Short |
| NYSE | AAPL | Short (Venta en Corto) |
| NYSE | FB | Short (Venta en Corto) |
| NYSE | X | Short (Venta en Corto) |
| NYSE | UVXY | Long (Compra) |
| CRYPTO | BTCUSD | Long (Compra) |
| BMV | CEMEX | Long (Compra) |
| BMV | TELEVISA | Short (Venta en Corto) |
| BMV | WALMEX | Long (Compra) |
| BMV | ALFA | Long (Compra) |
These are the trade that I will follow during the week. I comment as an opinion and should not be taken as financial advice. If you have any doubt, read the Terms and Conditions of the site.

AAPL has to mark a cross of macd lines down. This is the red line of macd below the blue signal line to enable a potential short selling trend.
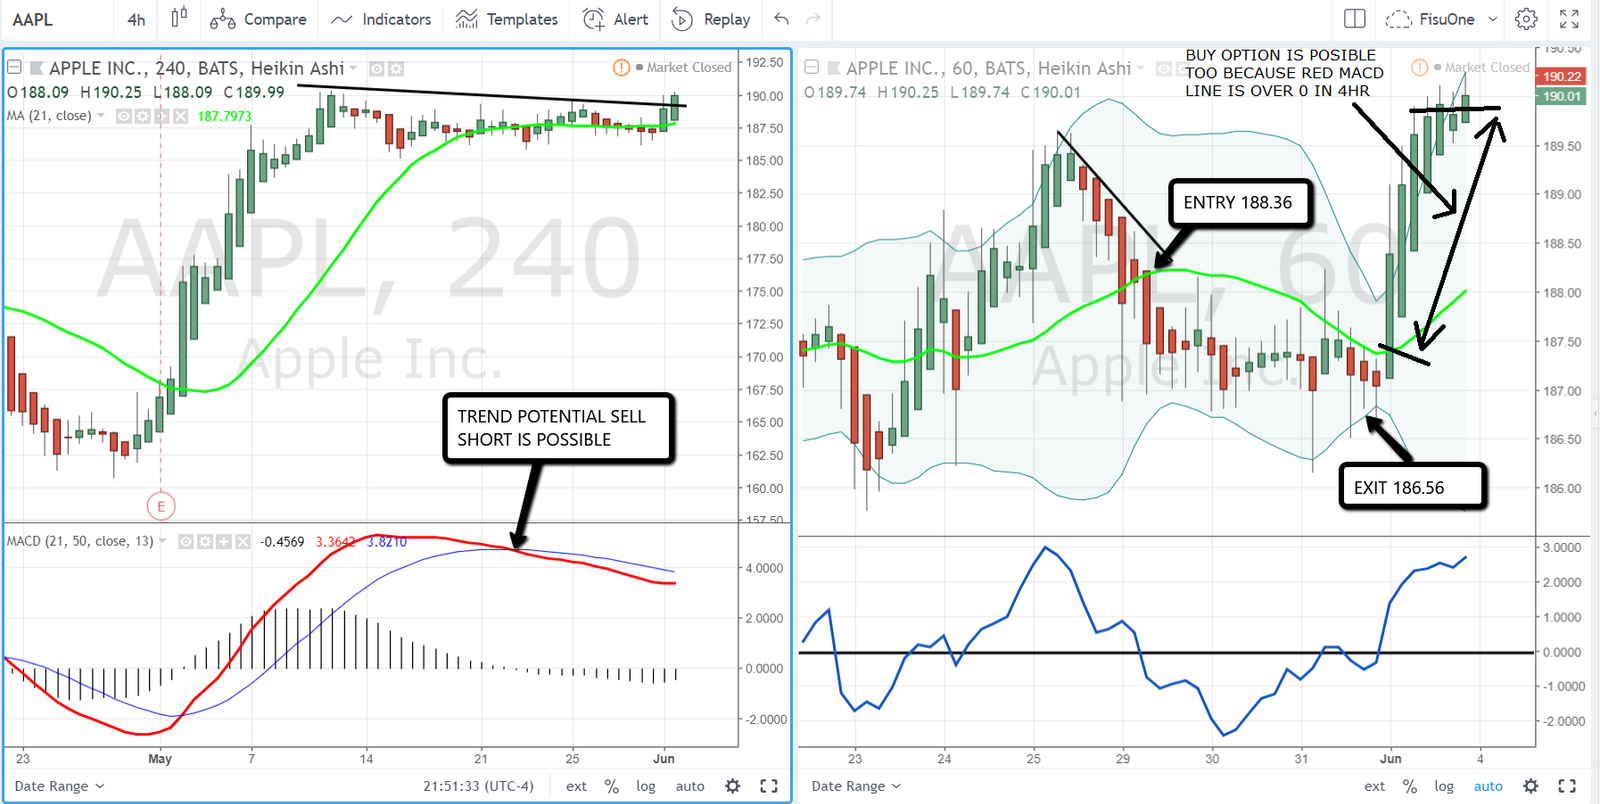
Last week we commented that aapl, in the 4hr chart, should mark the crossing of lines towards the short side. The red line must be below the blue line to indicate potential sales trend. This can be seen in the 4hr chart on the left. Then, the income that gave in 1hr was in 188.36 and the exit in 186.56 giving 0.9% in the week. The exit at 186.56 occurred because the price started to lateralize and there was no price strength towards the short sale. It is worthwhile to see the behavior of the blue line of momentum as you want to go to the opposite side, that is, towards the purchase and get to cross the zero line in the other direction. This is another signal that reinforces that the trade sell short does not work in this operation.

FB must cross its MACD lines towards the short as indicated in the graph on the left. We must wait for this signal for the short entry.
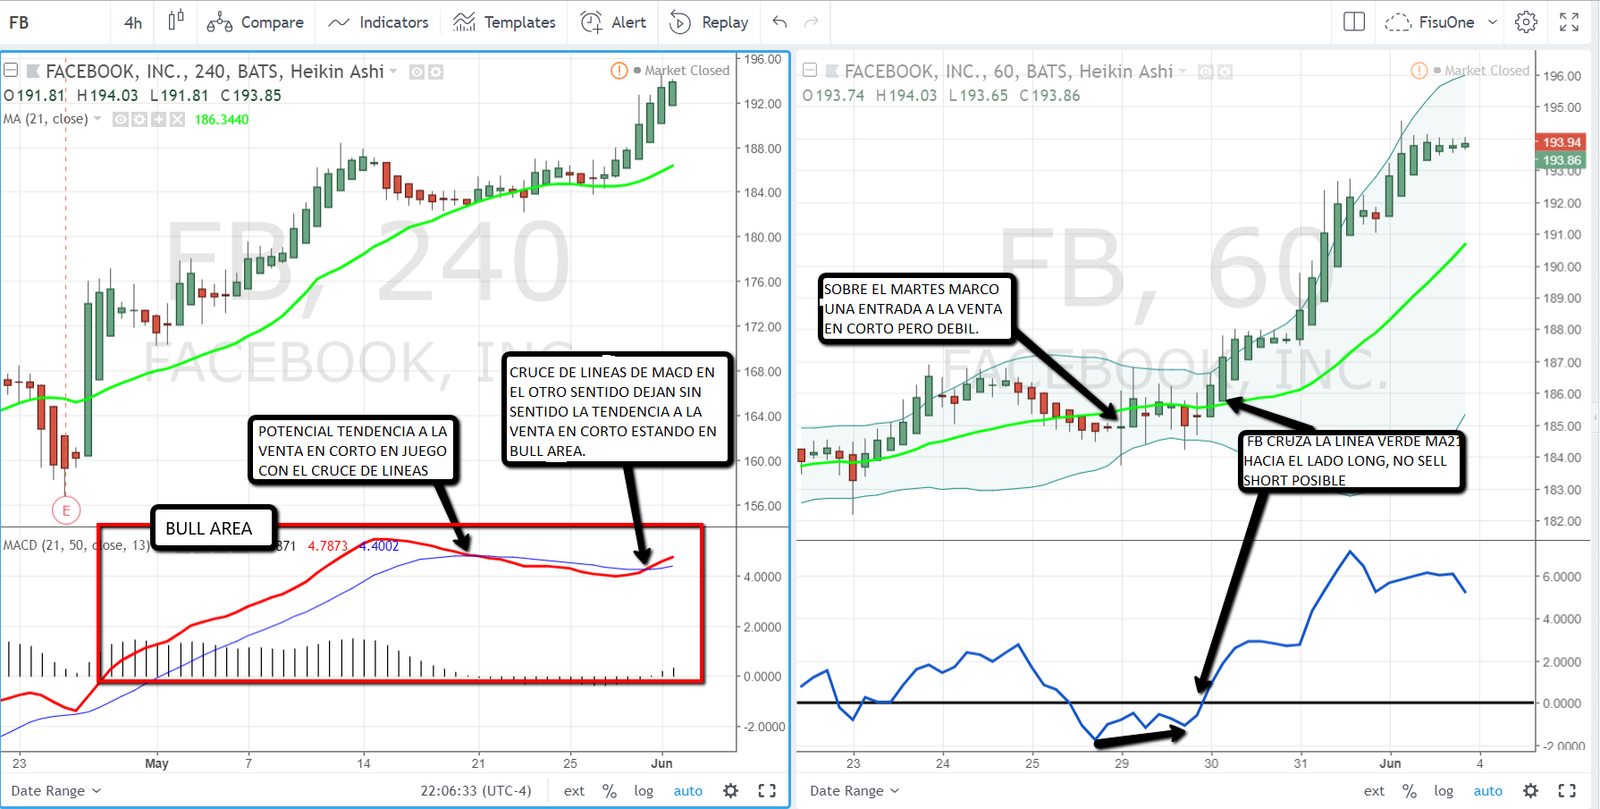
Although at the beginning of the week you can see the 4hr chart on the left where the MACD lines cross slightly, on the right chart of 1hr it never gives a strong sell signal. This trade was not advisable for the short. In the case of entering, it should be noted that as soon as the green line ma21 crosses in the direction opposite to our trade, the trade must be abandoned and that occurs on the same day and almost at the same level as the entry price of the chart of 1hr on the right. That’s what I mean by a weak entry.
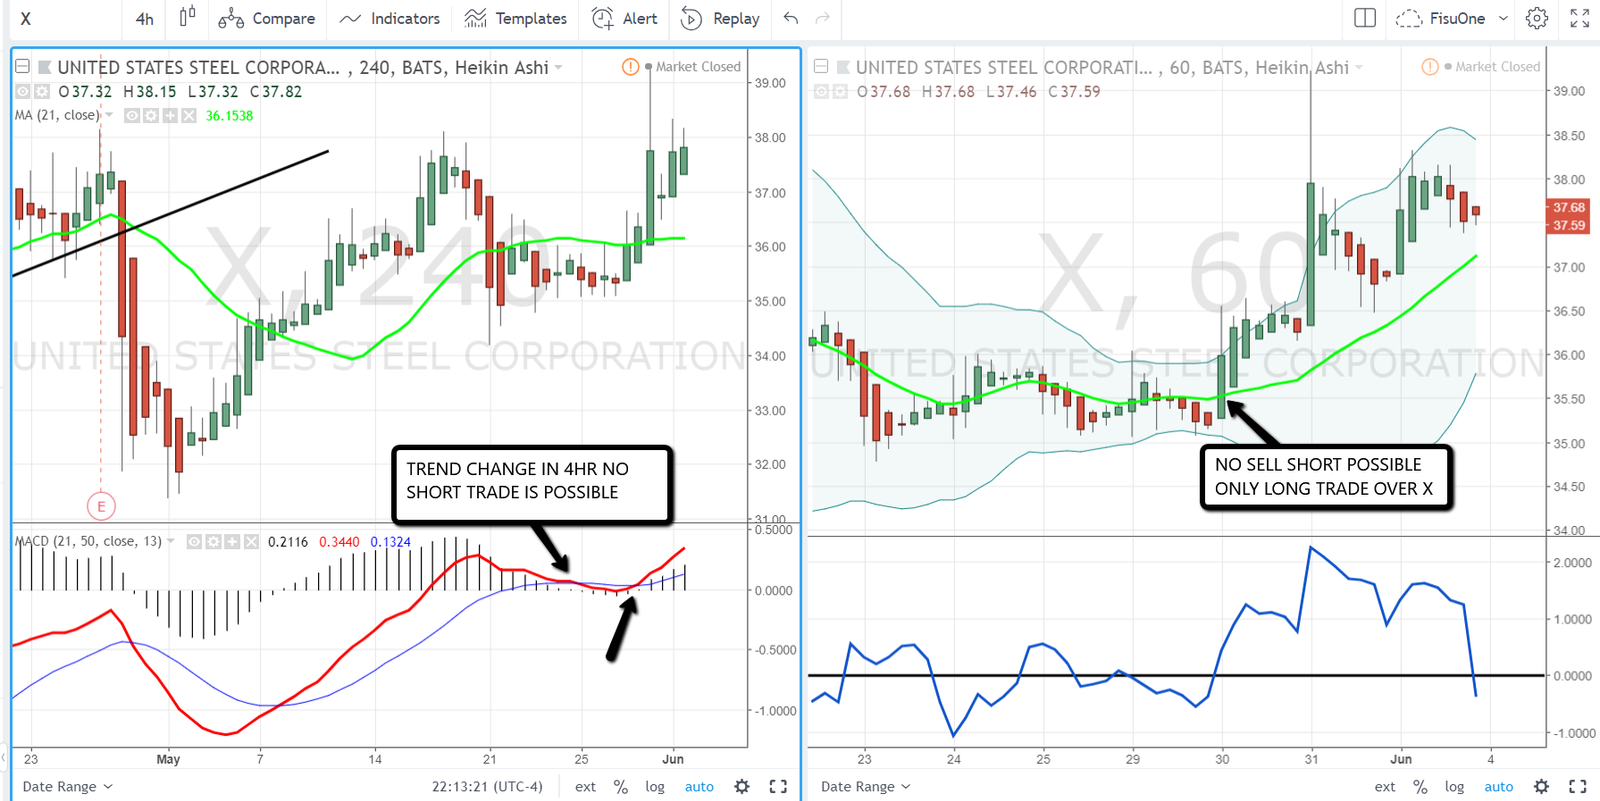
In Us Steel, something similar happened to fb. The tendency to short selling that seemed to be about to occur, was reversed in the week canceling the possibility of selling short in this action.
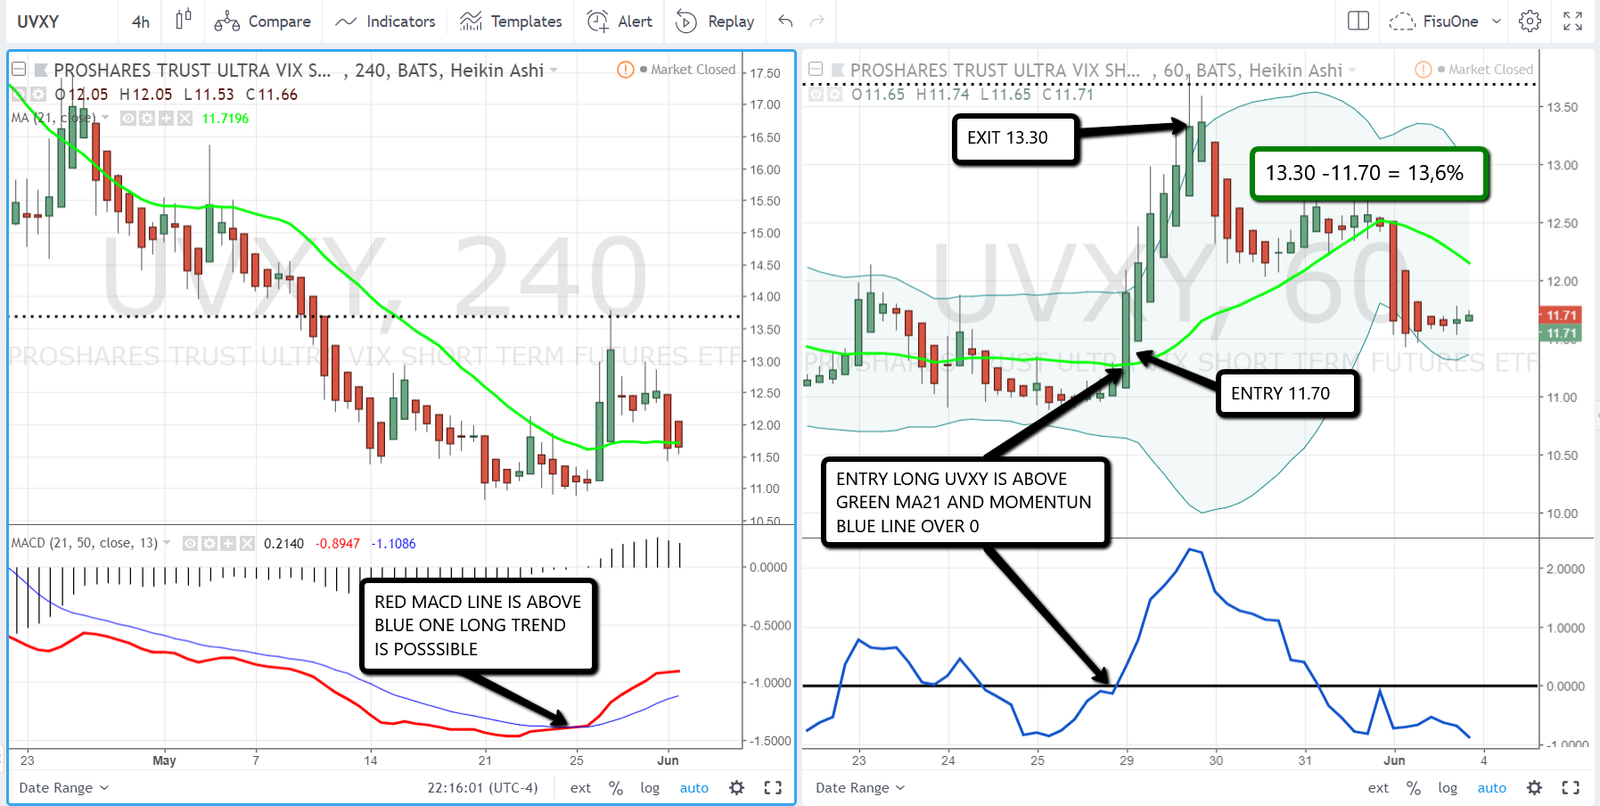
In the week, the case of the trade UVXY long, the trend in MACD of 4hr chart on the left, confirmed the potential of trend to purchase. Red MACD line above the blue line. In the graph on the right then you have to look for the income to buy and that occurs when UVXY cuts the green line MA21 at 11.70 and reaches 13.30 giving 11% where it then starts to fall. It should be noted that this etf that represents the volatility of the vix is extremely difficult to trade since it is excessively changing. Here is a detail of the trade he gave this week.
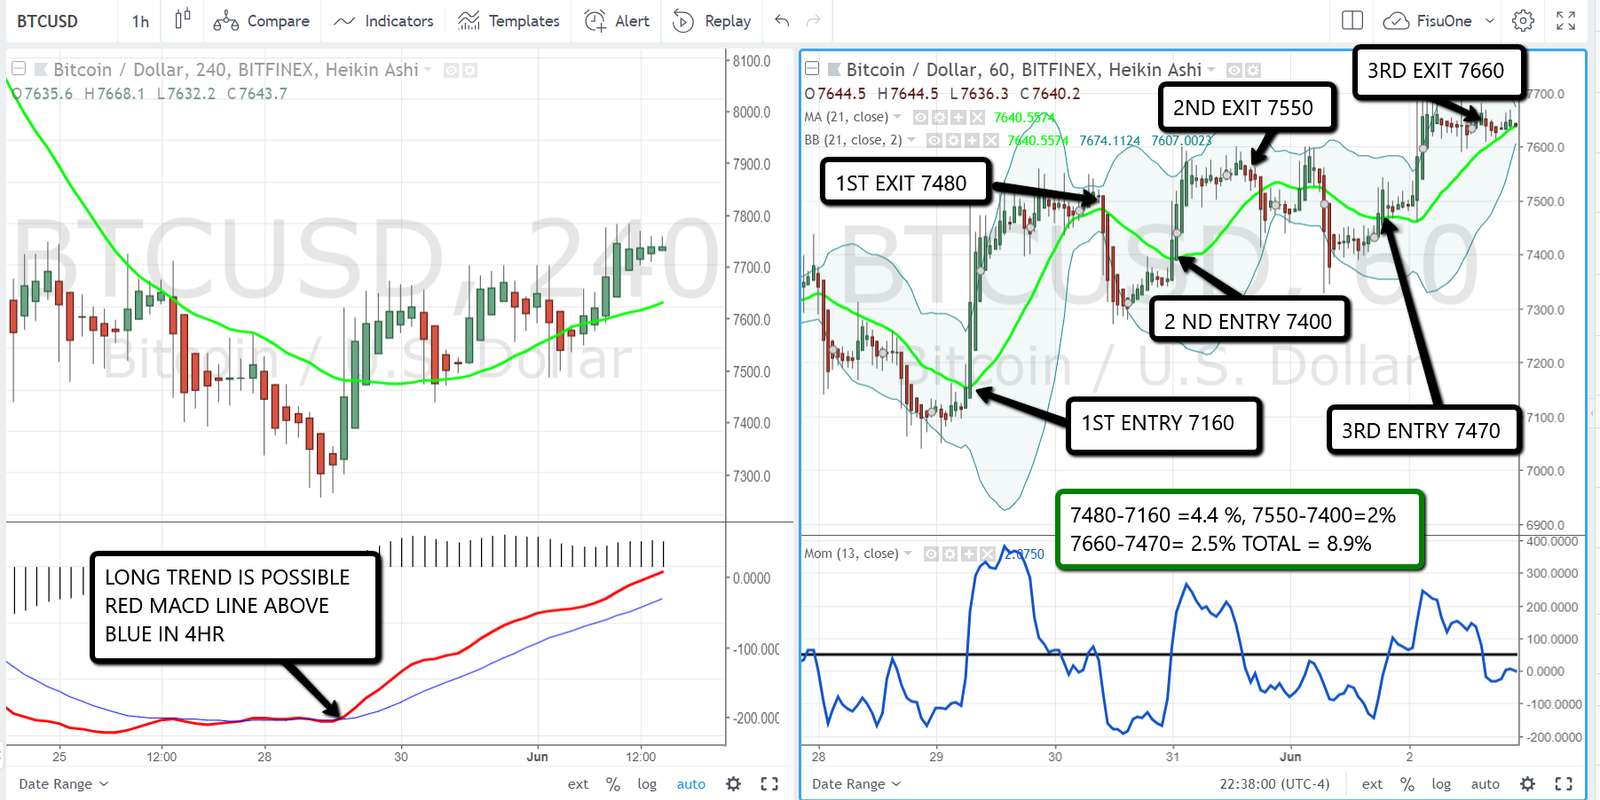
The bitcoin had already indicated in the chart on the left a potential tendency to purchase, so during the week we had to pay attention for transactions to the purchase on the 1hr chart on the right. This happened on 3 occasions, whenever the price crossed the green line ma21 upwards as shown in the graph, adding a total of 8.9% in the week.
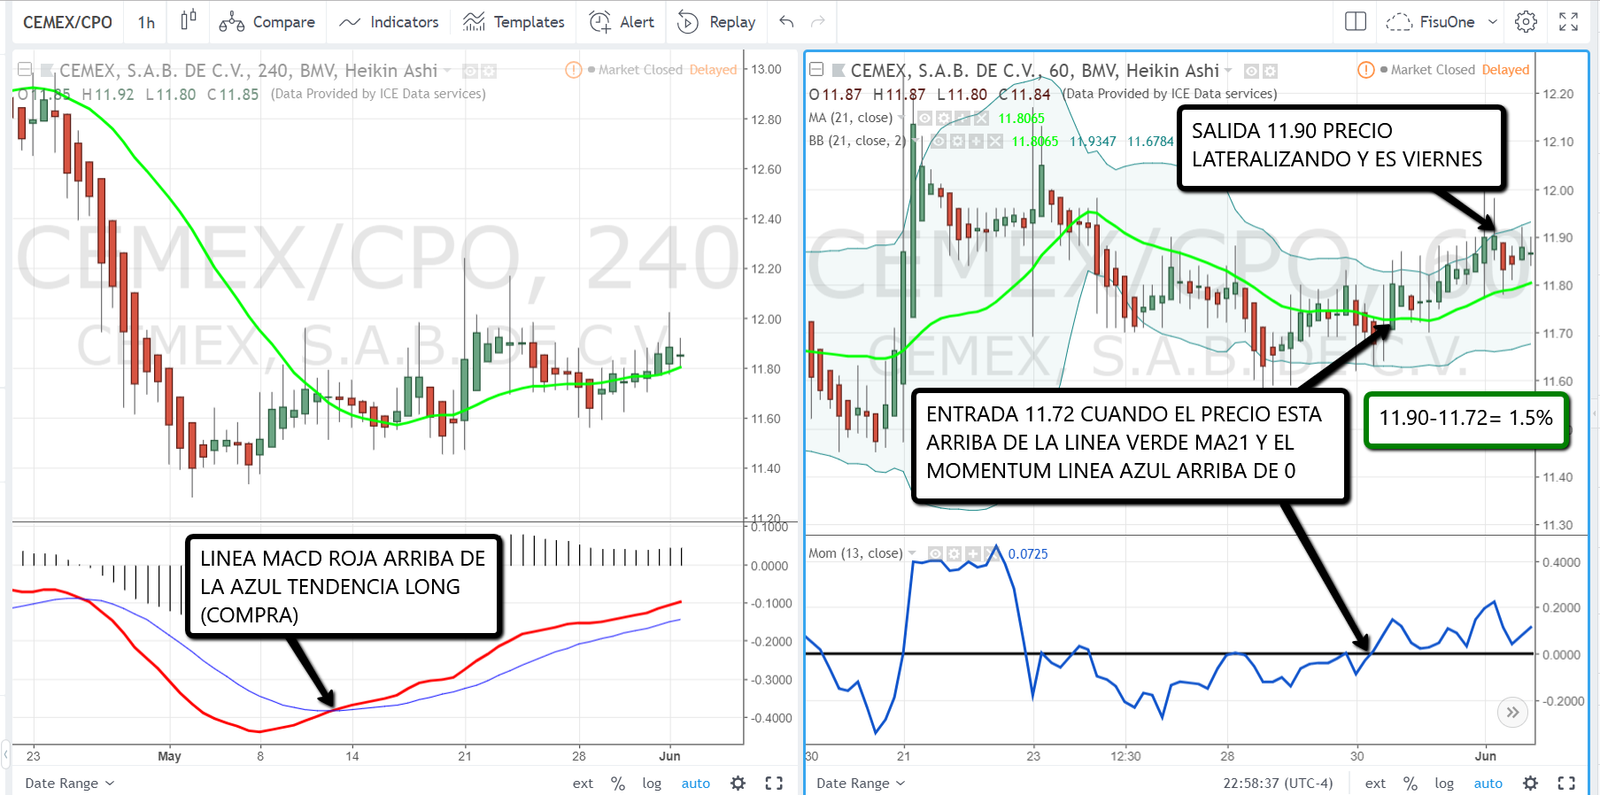
Cemex gave a signal in the graph on the left of the potential purchase trend. Therefore, you have to look for purchase transactions in this action of the bmv. That is when Cemex cuts the green line up and the blue line of the moment crosses the line from zero upwards. In this case, the operation gave 1.5% in the week.
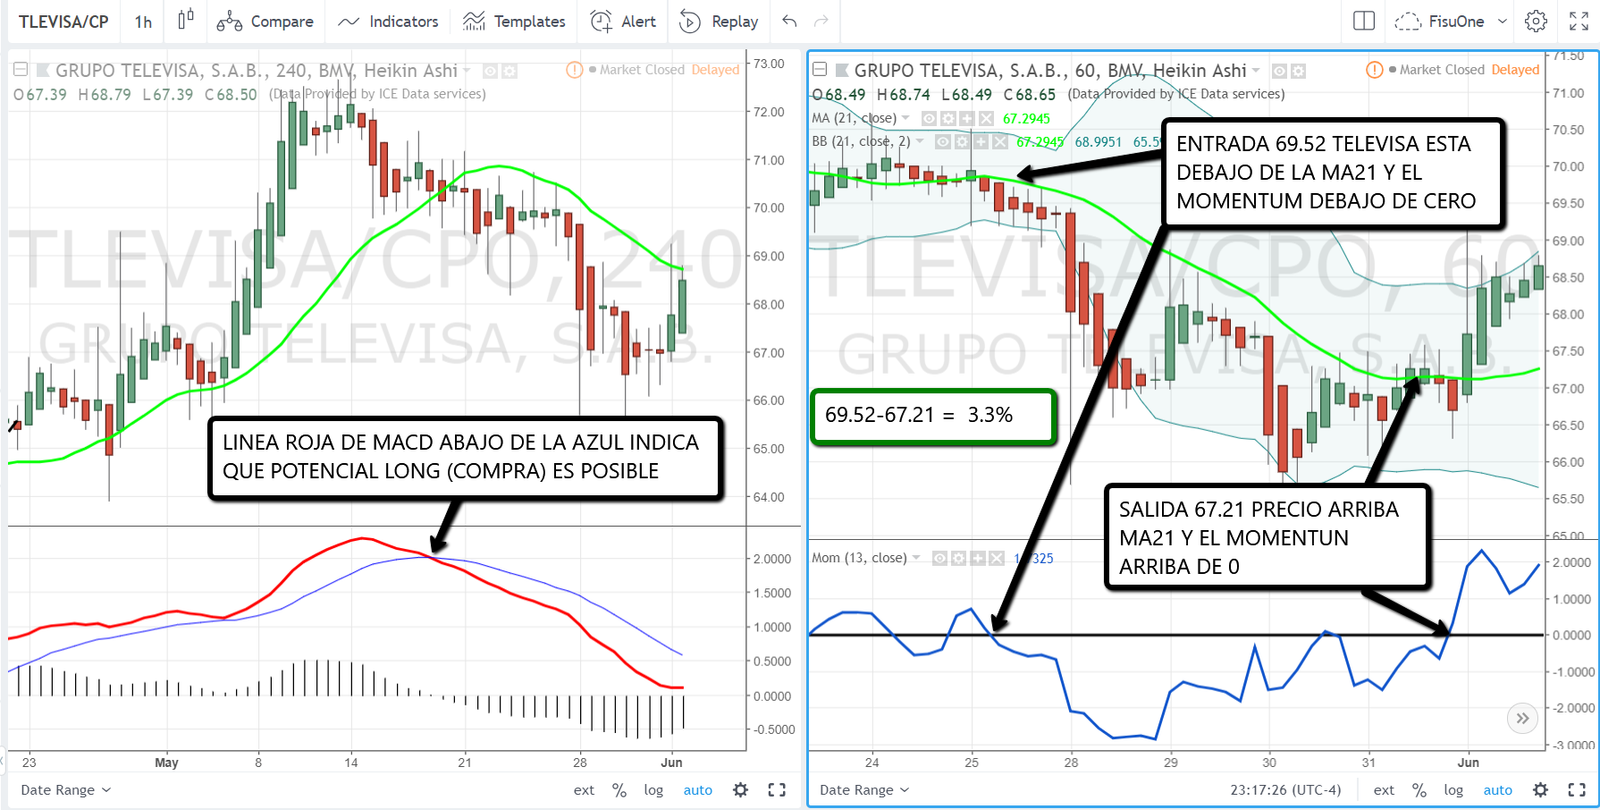
Televisa gave a signal of potential short sale trend in the 4hr chart on the left and it is to observe that, while the BMV rose, this stock was down except on Friday. Therefore looking for operations to be sold short in the week occurred at 69.52 when Televisa cut down the green line of MA21 and at the same time, as shown in the graph, giving output when it cuts the green line MA21 in the direction otherwise giving 3.3% in the week.
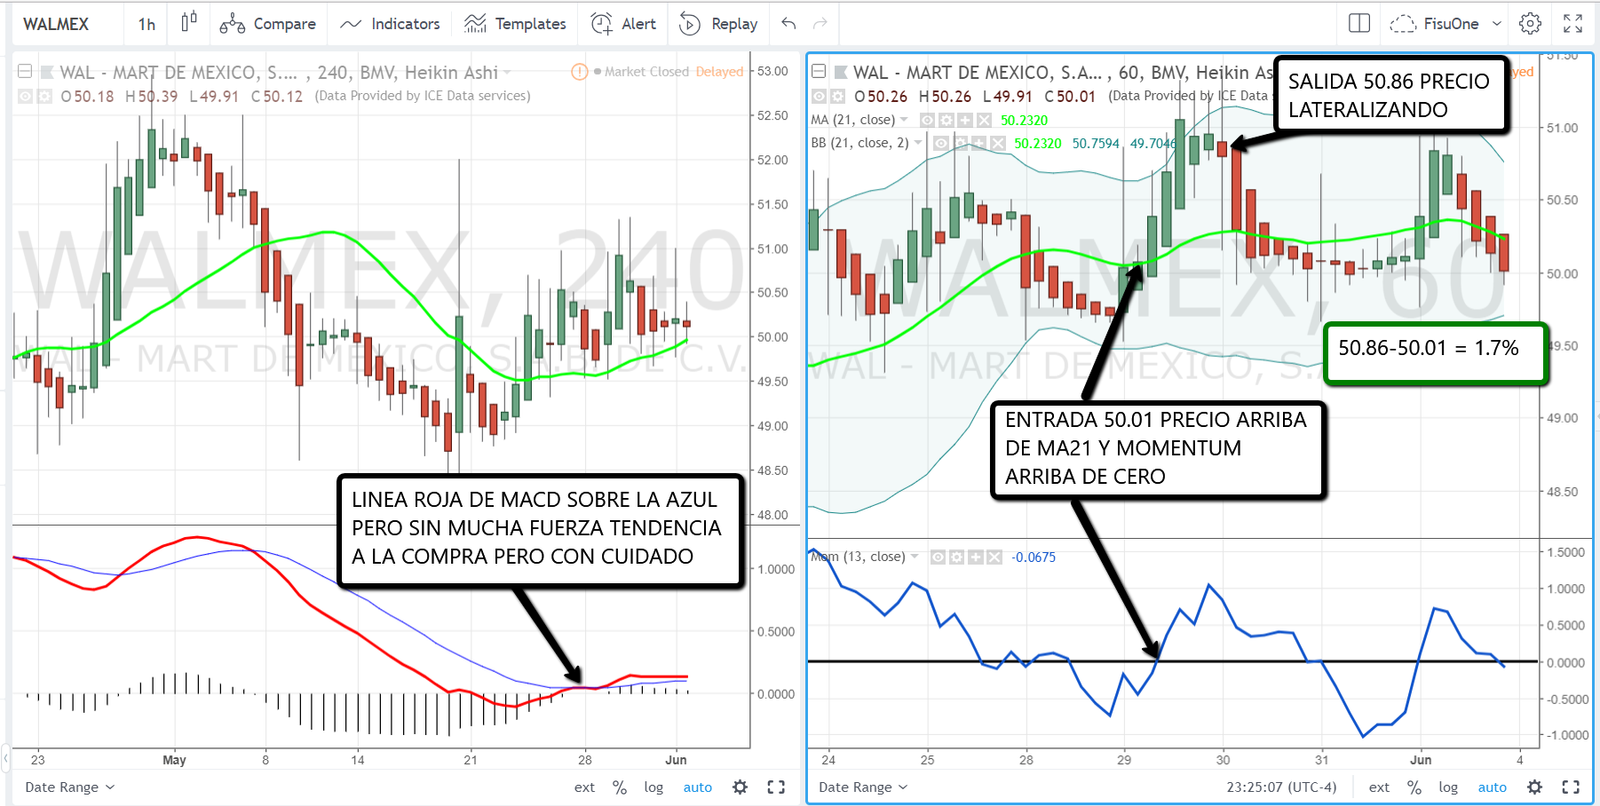
Walmex gave a signal of tendency to the potential purchase reason why, in this action of the BMV, it was necessary to look for the week of purchase operations when the price of the same surpasses the green line of MA21 in the graph of the right and the momentum at the same time exceed the zero line. Gave 1.7% on the week.
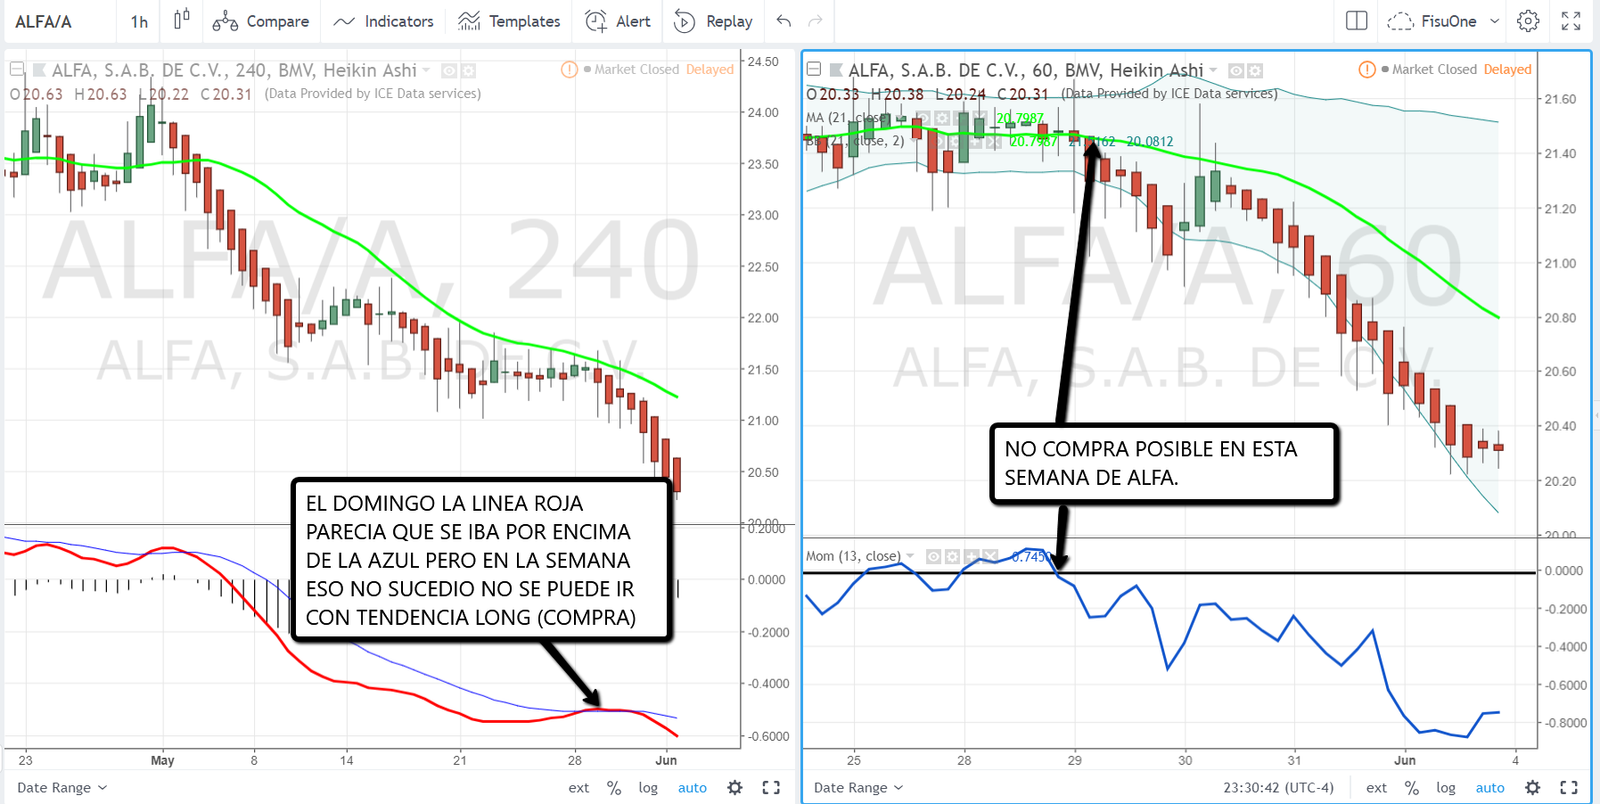
Last Sunday, Alfa seemed to be able to give a tendency to buy on the 4hr chart on the left but that did not happen. Therefore, there was no operation to purchase in this action.
Comments are closed here.